I have two setups: one runs on windows 10 (ntfs partition), the other on debian (ext4 partition). The R source code is the same. The main process starts 8 child-processes (P-SOCKS) -- on 8 vcores -- which all query and write to the same WAL enabled sqlite database.
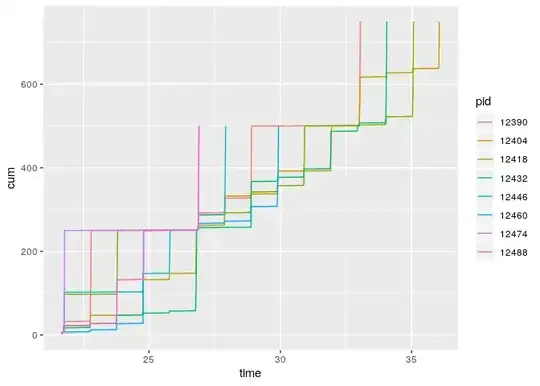
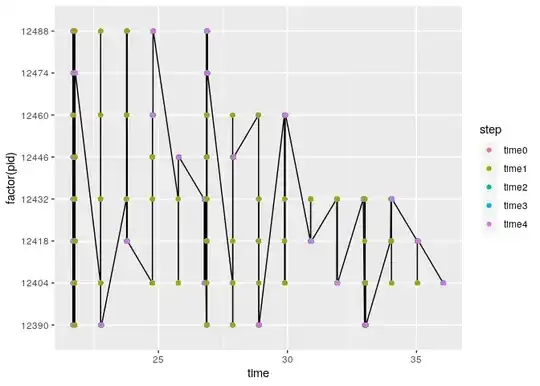
On windows 10 I get 100 % CPU load distributed over all the processes. On debian, I hardly get 25 % CPU load. Monitoring the processes on debian I think writes are the bottlenecks since I see only one process hitting 100 % on its vcore at a time. (The others are probably waiting to write.)
Each connection is using PRAGMA busy_timeout = 60000; and PRAGMA journal_mode = WAL;.
I am trying to debug this. I have tried PRAGMA synchronous = OFF; thinking it could have something to do with fsync(), but I don't see any improvement. Any other suggestions to what might be causing the low performance on debian?
Edit:
Write-Cache seems to be enabled on the SCSI disk (checked with sdparm) and tweaking ext4 mount options such as barrier=0 and data=writeback do not seem to have any effect.
Benchmarking
Here is some simple code for benchmarking concurrent writes:
make.con <- function() {
  con <<- DBI::dbConnect(RSQLite::SQLite(), dbname = 'db.sqlite')
  DBI::dbExecute(con, 'PRAGMA journal_mode = WAL;')
  DBI::dbExecute(con, 'PRAGMA busy_timeout = 60000;')
  DBI::dbExecute(con, '
    CREATE TABLE IF NOT EXISTS tmp (
      id INTEGER NOT NULL,
      blob BLOB NOT NULL,
      PRIMARY KEY (id)
  )')
}
make.con()


fn <- function(x) {
  set.seed(x)
  # read
  random.blob.read <- RSQLite::dbGetQuery(con, 'SELECT blob FROM tmp WHERE id = (SELECT abs(random() % max(tm.id)) FROM tmp tm);')
  # write
  blob <- serialize(list(rand = runif(1000)), connection = NULL, xdr = FALSE)
  RSQLite::dbExecute(con, 'INSERT INTO tmp (blob) VALUES (:blob);', params = list('blob' = list(blob)))
}

n <- 30000L

parallel::setDefaultCluster(parallel::makeCluster(spec = 2L))
parallel::clusterExport(varlist = 'make.con')
invisible(parallel::clusterEvalQ(expr = {make.con()}))

microbenchmark::microbenchmark(
  lapply(1:n, fn),
  parallel::parLapplyLB(X = 1:n, fun = fn, chunk.size = 50L),
  times = 2L
)

parallel::stopCluster(cl = parallel::getDefaultCluster())
Code simply reads and writes blobs to the database. First, do some dummy runs and allow the database to increase to a few GB.
On my windows 10 laptop I get these results (6GB database):
Unit: seconds
                                                       expr      min       lq     mean   median       uq      max neval
                                            lapply(1:n, fn) 26.02392 26.02392 26.54853 26.54853 27.07314 27.07314     2
 parallel::parLapplyLB(X = 1:n, fun = fn, chunk.size = 50L) 15.73851 15.73851 16.44554 16.44554 17.15257 17.15257     2
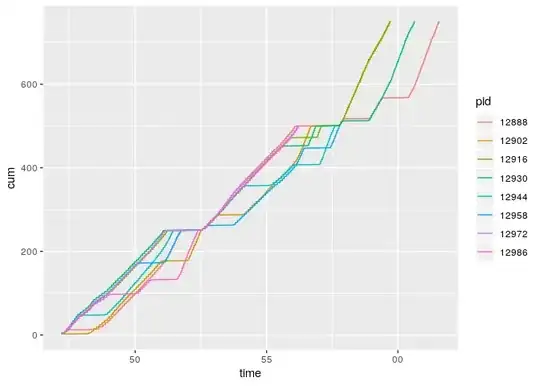
I clearly see 1 vcore at 100 %, then 2 vcores at 100%. The performance is almost twice as fast which shows that 2 concurrent processes do not block each other.
On debian I get this:
Unit: seconds
                                                       expr      min       lq     mean   median       uq      max neval
                                            lapply(1:n, fn) 39.96850 39.96850 40.14782 40.14782 40.32714 40.32714     2
 parallel::parLapplyLB(X = 1:n, fun = fn, chunk.size = 50L) 43.34628 43.34628 44.85910 44.85910 46.37191 46.37191     2
The two vcores never max out. Also, there is no performance improvement when using 2 processes -- it is even worse as they seem to block each other. And lastly, debian is on better (albeit virtualized) hardware.