0

I have a dataframe df:

df <- data.frame (group  = c("east", "west"),
                  value = c(1/3, 2/3)
)

d <- data.frame(x = rep(df$value, times = c(2,1)))  %>%
  ggplot(aes(x = x, y = 1, fill = x)) +
  geom_col(position = 'stack', color = 'white', linewidth = 0.1, width = 1) +
  scale_y_continuous(limits = c(-5, 5)) +
  theme_void()

I got the following warning message:

`position_stack()` requires non-overlapping x intervals 

column diagram

The plot I got is like this. But I want the blue bars to be stacked on top of another and have the same width, with the dark blue part taking 1/3 of the width and the light blue part taking 2/3. example
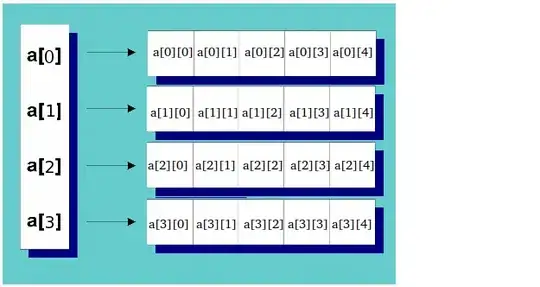
Also, how can I get rid of the warning message?

MicL
  • 67
  • 1
  • 8
  • they should be stacked atop each other with the same width; but they should also have different width, with darkblue being 1/3 and light being 2/3. so are they are the same width ? or different widths ? – Nir Graham Aug 09 '23 at 10:56
  • I just edited my question. – MicL Aug 09 '23 at 11:02

1 Answers1

0
df <- data.frame (group  = c("east","east", "west"),
                  value = c(1/3,1/3, 2/3),
                  x = c(1L,0L,0L)
)

df$group <- factor(df$group,levels=c("west","east"))
library(ggplot2)

ggplot(data = df,
       aes(x = x, y = value, fill = group)) +
  geom_col(linewidth = 0.1, width = 1) +
  coord_flip(xlim = c(-2,2)) +
  scale_fill_manual(values = c("east"="darkblue",
                               "west"="lightblue")) +
  theme_void()

enter image description here

Nir Graham
  • 2,567
  • 2
  • 6
  • 10
  • Thanks, but I want two layers of dark blue block, one stacks over the other. – MicL Aug 09 '23 at 11:34
  • your verbal description is ambigious to me , but I edited based on your second picture. with the white scribble out – Nir Graham Aug 09 '23 at 12:36