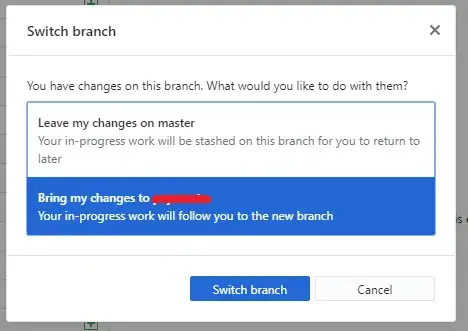
I am trying to visualize the queries of a graph created in AGE using AGE Viewer but I can't see the graph I created. This is the issue 
I followed the exact steps to visualizing a graph using
npm run setup
followed by
npm run start.
How can I solve this and make graph path display so I can easily visualize queries?
