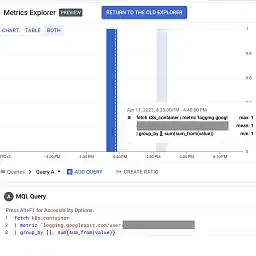
I have a custom log-based metric setup that tracks API calls. The metric is setup as a distribution metric. I'm trying to plot the total number of API calls in a dashboard.
It was quite difficult to figure out I had to use MQL for this, as the UI query builder does not allow this. I succeeded in crafting the following MQL query:
fetch k8s_container
| metric 'logging.googleapis.com/user/num_api_calls'
| group_by [], sum(sum_from(value))
This is based on the docs.
However, when I plot this, the aggregates on an hour level are wrong: when I zoom in I see 2 API calls (separate bars in my chart). When I zoom out I see only 1 API call (screenshots below).
It seems the aggregation does not work as I expected, which lead my to try out the following:
fetch k8s_container
| metric 'logging.googleapis.com/user/num_api_calls'
| group_by 1m, [value_num_api_calls_aggregate: sum(sum_from(val()))]
| every 1m
| group_by [metric.dag_id],
    [value_num_api_calls_aggregate_aggregate:
       sum(value_num_api_calls_aggregate)]
and also (different aggregations):
fetch k8s_container
| metric 'logging.googleapis.com/user/num_api_calls'
| group_by 1m, [value_num_api_calls_aggregate: aggregate(val())]
| every 1m
| group_by [metric.dag_id],
    [value_num_api_calls_aggregate_aggregate:
       sum(sum_from(value_num_api_calls_aggregate))]
Again the aggregates are wrong (same result). I tried setting the windows to 1h instead of 1m. This seems to work, but is not what I want.
It seems I'm misunderstanding something in this query language. Any help on getting this to work is greatly appreciated!

