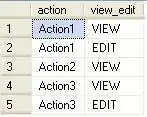
I am trying to add sparklines to multiple columns of a Data Table in R. I am able to get a single Sparkline column to render correctly, but when I try to render a sparkline in a second column based on different underlying data than the first, the same sparkline is displayed in the second column. I imagine there is some snippet of code needed in the fnDrawCalback option, but I have not been able to find much out there addressing my issue.
Here is a reproducible example for both a single sparkline (works) and a two sparklines (just repeats the first sparkline in both columns)
# create data with single sparkline column
library(sparkline)
library(DT)
spark_data <- data.frame(
  id = c('spark1', 'spark2'),
  spark = c(
    spk_chr(values = 1:3, elementId = 'spark1'),
    spk_chr(values = 3:1, elementId = 'spark2')
  )
)

tbl <- datatable(spark_data, escape = F,
                 rownames = F
  , options = list(fnDrawCallback = htmlwidgets::JS('function(){
                                                           HTMLWidgets.staticRender();
                                                              }'))
)

spk_add_deps(tbl)
# create data with two sparkline columns
library(sparkline)
library(DT)
spark_data <- data.frame(
  id = c('spark1', 'spark2'),
  spark = c(
    spk_chr(values = 1:3, elementId = 'spark1'),
    spk_chr(values = 3:1, elementId = 'spark2')
  ),
  second_spark = c(spk_chr(values = 3:1, elementId = 'spark1'),
                   spk_chr(values = 1:3, elementId = 'spark2'))
)

tbl <- datatable(spark_data, escape = F,
                 rownames = F
  , options = list(fnDrawCallback = htmlwidgets::JS('function(){
                                                           HTMLWidgets.staticRender();
                                                              }'))
)

spk_add_deps(tbl)

