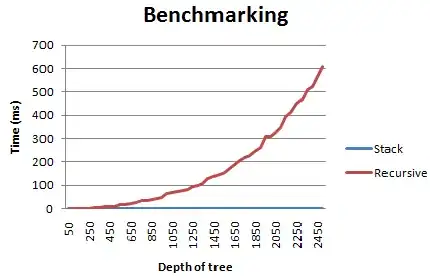
I would like to create the following plot with Python in PyCharm:
I am using the following code:
import matplotlib.pyplot as plt
from matplotlib.gridspec import GridSpec


def format_axes(fig):
    for i, ax in enumerate(fig.axes):
        ax.text(0.5, 0.5, "ax%d" % (i+1), va="center", ha="center")
        ax.tick_params(labelbottom=False, labelleft=False)

fig = plt.figure(constrained_layout=True)

gs = GridSpec(3, 3, figure=fig)
ax1 = fig.add_subplot(gs[:2, 0])
ax2 = fig.add_subplot(gs[:2, 1:])
ax3 = fig.add_subplot(gs[-1, 1:])

fig.suptitle("GridSpec")
format_axes(fig)

plt.show()
However I've got the following warning:
UserWarning: constrained_layout not applied. At least one axes collapsed to zero width or height.
Does anybody know how to get rid of this warning?

