0

I have an array x_trj that has shape (50,12), and I would like to make an animation for all the rows corresponding to certain columns in a 2-D plot (so I can see what direction each line is going). Below is my code:

from matplotlib.animation import FuncAnimation

fig,ax = plt.subplots()

# Plot initial line to fill in as we go
line, = ax.plot([], [], lw=2)

def init():
    line.set_data([], [])
    return line,

def animate(i):
    # Plot resulting trajecotry of car
    
    line.set_xdata(x_trj[i,0:9:4])
  

    line.set_ydata(x_trj[i,1:10:4])
   

    return line,


anim = FuncAnimation(fig, animate, init_func = init, frames=x_trj.shape[0], interval=200) # animation doesn't show up?

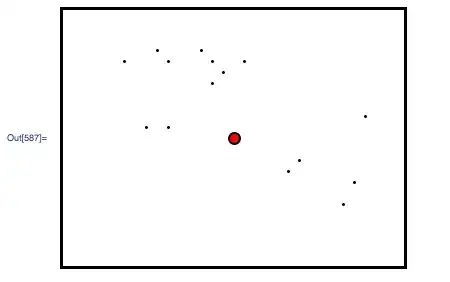
However, the animation does not show up at all. All I get is an empty figure. How should I fix this issue? I am writing my code in Google colab. The animation shows up but it's empty (it has a built-in play button):
enter image description here

Trenton McKinney
  • 56,955
  • 33
  • 144
  • 158
Randy Chen
  • 107
  • 8
  • 1
    `x_traj[i, 1]` is just one data value. Looks like your really want `x_traj[I, 1:10:4]` which will take every 4th value. https://numpy.org/doc/stable/user/basics.indexing.html – Jody Klymak May 16 '22 at 14:20
  • that makes sense! But somehow, after I changed `set_xdata` and `set_ydata` in this way, the animation is still empty – Randy Chen May 16 '22 at 14:31
  • Can you make _any_ animations show up? There are quite a few examples on the Matplotlib site. Did you "show" the animation somehow? I don't know anything about google colab, but if it doesn't have an interactive backend, I don't think the animation will show up. – Jody Klymak May 16 '22 at 14:38
  • What does `x_traj` contains? What's its shape? – Davide_sd May 16 '22 at 15:08
  • the animation actually shows up, and there is a play button, but it's an empty figure. I will add that to my original post – Randy Chen May 16 '22 at 16:29
  • you could use `random` to create some example data in `x_traj` so we could simply copy and run code. And then we can test it and check solutions. – furas May 16 '22 at 21:55
  • did you test code on local computer without `Google Colab` ? Did you use `print()` to see if it runs `set_xdata` and what you put in `line` ? Maybe it put values which are not visible in region which shows plot and it would need to set new `xlim`, `ylim` to "scroll" area in plot. – furas May 16 '22 at 21:56

1 Answers1

0

I don't know what values you have in x_traj but I had to set xlim, ylim to see animation because animation doesn't change visible area automatically and it displays line in area which I can see.

I tested it only on local computer.

import matplotlib.pyplot as plt
from matplotlib.animation import FuncAnimation
import numpy as np

np.random.seed(0)  # `randint()` will always select the same values
x_trj = np.random.randint(0, 10, (52,12))

fig, ax = plt.subplots()
ax.set_xlim(0, 10)  # it would need to get min(), max() values from x_trj
ax.set_ylim(0, 10)  # it would need to get min(), max() values from x_trj

#ax = plt.axes(xlim=(0, 10), ylim=(0, 10))  # needs `ax =`

line, = ax.plot([], [], lw=2)

def init():
    line.set_data([], [])
    return line,

def animate(i):
    print('i:', i)

    x = x_trj[i,0:9:4]
    y = x_trj[i,1:10:4]
    print('x,y:', x, y)

    line.set_xdata(x)
    line.set_ydata(y)

    return line,

anim = FuncAnimation(fig, animate, init_func=init, frames=x_trj.shape[0], interval=200)

plt.show()

Eventually you can change xlim, ylim during animation to change visible area but this may not look as you expect.

def animate(i):
    print('i:', i)

    x = x_trj[i,0:9:4]
    y = x_trj[i,1:10:4]
    print('x,y:', x, y)

    line.set_xdata(x)
    line.set_ydata(y)

    ax.set_xlim(min(x), max(x))  # change visible are
    ax.set_ylim(min(y), max(y))  # change visible are

    return line,
furas
  • 134,197
  • 12
  • 106
  • 148