I'm trying to size nodes of a tree by both the weight (which is equivalent to the nodes width in this context) and by it's height. To do this im using both tidygraph
and ggraph.
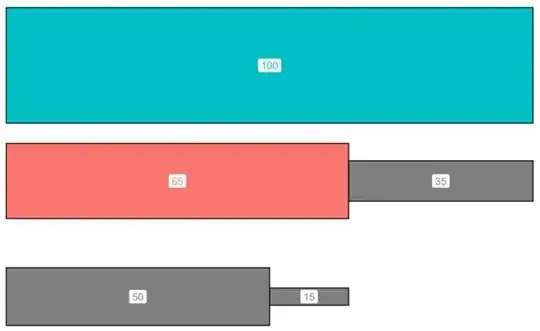
For example, if I create some data and turn it into a tidygraph object, I can then plot the tree using ggraph. If I just use the weight argument (in the ggraph call) I get a plot like the one below:
library(tidygraph)
library(ggraph)

# create some data
nodes <- tibble(
  var = c("x4", "x1", NA, NA, NA),
  size = c( 100, 65, 50,  15, 35)
)

edges <- tibble(
  from = c(1,2,2,1),
  to   = c(2,3,4,5)
)

# turn in tidygraph object
tg <- tbl_graph(nodes = nodes, edges = edges)

# plot using ggraph
ggraph(tg, "partition", weight = size) +
  geom_node_tile(aes(fill = var)) +
  geom_node_label(aes(label = size, color = var)) +
  scale_y_reverse() +
  theme_void()+
  theme(legend.position = "none")
This scales the width of the trees nodes by the parameter nodes$size. However, if I try the same thing, except I replace the weight argument with height, that is:
# plot using ggraph
ggraph(tg, "partition", height = size) +
  geom_node_tile(aes(fill = var)) +
  geom_node_label(aes(label = size, color = var)) +
  scale_y_reverse() +
  theme_void()+
  theme(legend.position = "none")
I get a plot that omits the 1st node (as shown below) and the following error:
Warning message: In hierarchy$height[edges[, node_col]] <- height :
number of items to replace is not a multiple of replacement length
I would like to somehow combine both the weight and height arguments into a single plot.
I tried experimenting by putting the height argument into the aesthetics for geom_node_tile like so:
ggraph(tg, "partition", weight = size) +
  geom_node_tile(aes(fill = var, height = size/100)) +
  geom_node_label(aes(label = size, color = var)) +
  scale_y_reverse() +
  theme_void()+
  theme(legend.position = "none")
but that leaves gaps between the nodes:

Is there a way to scale the nodes by both weight and height but still have a connected nodes, like in the example below (which I quickly made in powerpoint):


