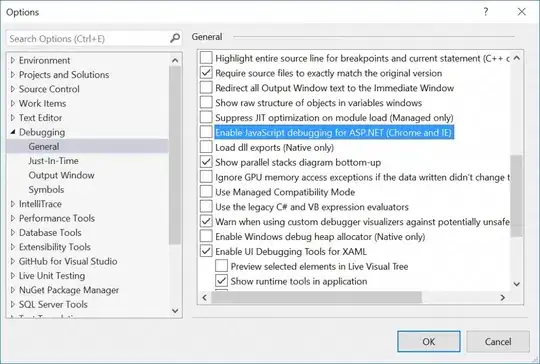
I am building a Bokeh app in VS code and whenever I hit Run (green arrow on top right), the changes open up to a new browser. I thought this would be easy to achieve but I am struggling to find a way where the same browser can just be refreshed whenever a change is made, instead of having a new browser opened up every time I hit run, for example
Is there a similar approach to Live Server used for html file for this? The code for my bokeh app is as below if it helps
from random import random

from bokeh.layouts import column, row, widgetbox, layout
from bokeh.models import Button
from bokeh.palettes import RdYlBu3
from bokeh.plotting import figure, curdoc

import pandas as pd
import pyodbc
from bokeh.plotting import figure, output_file, show, save
from bokeh.models import ColumnDataSource, HoverTool, CategoricalColorMapper, Legend, PrintfTickFormatter, CustomJS, Select
from bokeh.models.widgets import (Select)
from bokeh.models.widgets import Div


### Read in the data
df = pd.read_excel('RS data.xlsx')

### Set up Figure
p = figure(x_range=(0, 20), y_range=(0, 10), plot_height=400, plot_width=800)
p.add_layout(Legend(), 'right')
p.toolbar_location = None


df['Unique Story Count'] = df.groupby(['Person','Sprint'])['Story Id'].transform('nunique')

### Convert data into a bokeh data type
df1 = df[['Person', 'Sprint', 'Unique Story Count']]
df1['Person'].unique()
df1 = df1[df1['Person'] == 'Analyst 1'].drop_duplicates()
source1 = ColumnDataSource(df1)

x='Sprint'
y='Unique Story Count'

p1 = p.line(
    x=x, y=y,
    color='#d96ad5', line_color='#d96ad5',
    line_width=2, line_alpha=1, source=source1
)

p2 = p.circle(
    x=x,
    y=y,
    #legend_label='',
    size=6,
    fill_alpha=1,
    # color={'field': 'Submission', 'transform': mapper},
    source=source1
)

p.xaxis.ticker = list(range(0, 21))
p.xgrid.ticker = list(range(0, 21))

p.xaxis.axis_label = 'Sprint'
p.yaxis.axis_label = 'Story Count'

## tooltip for point
p.add_tools(HoverTool(
    renderers=[p2],
    tooltips=[
        ('Spri Num', '@Sprint'),
        ('Story Count', '@{Unique Story Count}')
    ],
    mode='mouse')
)

show(p)
