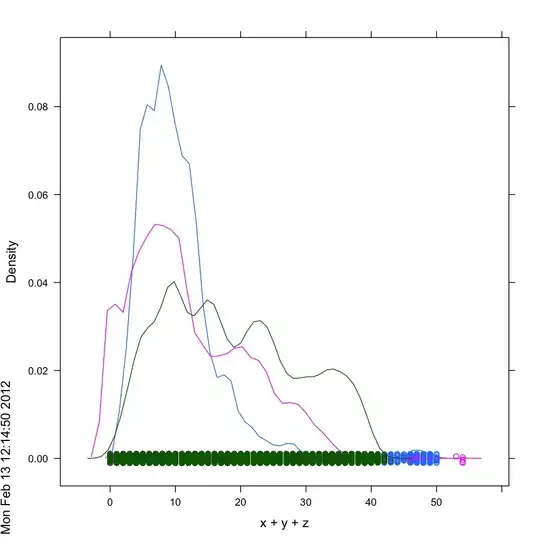
i need to create custom xaxis shown in this image in highcharts with angular .
.
in plain JS in jsfiddle I am able to achieve it, I tried same chart options in angular but i am getting like this, Can someone help me on what i did wrong?
 ,
,
i need to create custom xaxis shown in this image in highcharts with angular .
.
in plain JS in jsfiddle I am able to achieve it, I tried same chart options in angular but i am getting like this, Can someone help me on what i did wrong?
 ,
,
You need to import and initialize the highcharts-grouped-categories module: https://www.npmjs.com/package/highcharts-grouped-categories
import * as Highcharts from 'highcharts';
import HighchartsGroupedCategories from 'highcharts-grouped-categories';
import { Injectable } from '@angular/core';

HighchartsGroupedCategories(Highcharts);
Live demo: https://stackblitz.com/edit/highcharts-angular-demo-4y3css?file=src%2Fapp%2Fhighcharts.service.ts
Docs: https://github.com/highcharts/highcharts-angular#to-load-a-module