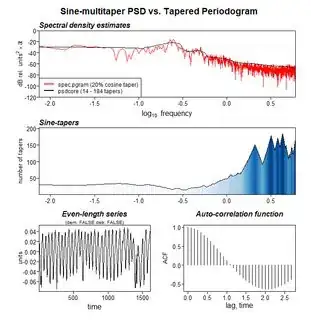
I have a timeseries for which I need PSD values using R. The data was sampled at non uniform intervals but I did a spline interpolation with the predict command to interpolate readings at exactly 0.01 seconds. I could obtain amplitude values from spec.pgram quite correctly but they are not psd values. However the psd values from the pspectrum command of the psd package are only between 0 and 0.5Hz while my area of interest extends to about 1.2Hz. The time series is: here
Asked
Active
Viewed 96 times
1 Answers
1
Note that your time points are not equidistant. For the sake of this answer, we'll assume a frequency of 12 samples per second.
You have to specify the frequency for psd::pspectrum. Assuming your data is loaded as a data.frame called x:
out <- pspectrum(x[, 2], x.frqsamp = 12)
plot(out)
The pspectrum function also has a more detailed plot:
out <- pspectrum(x[, 2], x.frqsamp = 12, plot = TRUE)
Alternative
You can also use stats::spectrum, but it will require you to create a ts object:
our_ts <- ts(data = x[, 2],
             start = 0,
             frequency = 12)
plot(stats::spectrum(our_ts))
EDIT: Given new dataset (freq = 100)
x <- read.csv("test2.csv", header = F)

out <- pspectrum(x[, 2], x.frqsamp = 100)
out$freq[which.max(out$spec)]
# [1] 0.265708

our_ts <- ts(data = x[, 2], start = 4, frequency = 100)
out2 <- stats::spectrum(our_ts)
out2$freq[which.max(out2$spec)]
# [1] 0.2777778
slamballais
- 3,161
- 3
- 18
- 29
-
That is very helpful. Earlier I had provided the link to the raw time series. I now provide the actual sample at 100Hz for 64 seconds https://drive.google.com/file/d/1jU9gXBO0DamTg2dsi30YgrdhhukRxikQ/view?usp=sharing It is strange that in your rendition above one is seeing the correct max freq of 0.28Hz but I am not when I do it with the subset linked above. Would you care to repeat the exercise with this sample. I am also curious where you got the xfrqsamp variable from in the documentation. It is really vital and I did not see it. – user2004198 May 30 '21 at 18:25
-
Hmm, works for me: `out <- pspectrum(x[, 2], x.frqsamp = 100) ; out$freq[which.max(out$spec)]` returns `0.26708`, which is sufficiently close. The same approach with `stats::spectrum` yields `0.2777778`, which is the closest frequency to 0.28 that it outputs. I'll add it at the bottom of the post. Also, you can find the `x.frqsamp` argument by typing `?pspectrum` and then going to `Arguments` section. With `?spectrum`, you can read the section called `Details`, where it specifically mentions `frequency(x)`. Since `spectrum` requires a `ts` object, you can also read `?as.ts` or `?ts`. – slamballais May 30 '21 at 21:24
-
I am still left with one issue. I really want to examine the fft between frequencies of 1.67Hz and 0.9Hz. I cannot find any signal there. Could you assist with that. – user2004198 May 31 '21 at 03:06
-
1Do you mean `out2$spec[out2$freq > 0.9 & out2$freq < 1.67]`? I'm not too familiar with more in-depth methods, so I cannot help much more than that! – slamballais May 31 '21 at 18:03


