0

I have configured javamelody 1.86.0 on Tomcat 8.8 and all the other metrics are captured except from the JDBC. Below are the config I have on the Tomcat application:

Context.xml:

<ResourceLink type="javax.sql.DataSource"
              name="jdbc/LocalAPIDB"
              global="jdbc/APIDB"/>

Server.xml:

<Resource type="javax.sql.DataSource"
          name="jdbc/APIDB"
          factory="org.apache.tomcat.jdbc.pool.DataSourceFactory"
          driverClassName="com.mysql.jdbc.Driver"
          url="jdbc:mysql://localhost:3306/apiDB"
          username="xxxx"
          password="xxxxx"
          initialSize="340"
          maxActive="3770"
          maxIdle="2330"
          minIdle="890"
          testOnBorrow="true"
          validationQuery="SELECT 1"
          validationInterval="30000"
          timeBetweenEvictionRunsMillis="5000"
          minEvictableIdleTimeMillis="60000"
          removeAbandoned="true"
          removeAbandonedTimeout="60"
          abandonWhenPercentageFull="0"
          logAbandoned="true"
          jdbcInterceptors="org.apache.tomcat.jdbc.pool.interceptor.ConnectionState;
org.apache.tomcat.jdbc.pool.interceptor.StatementFinalizer;org.apache.tomcat.jdbc.pool.interceptor.ResetAbandonedTimer"/>

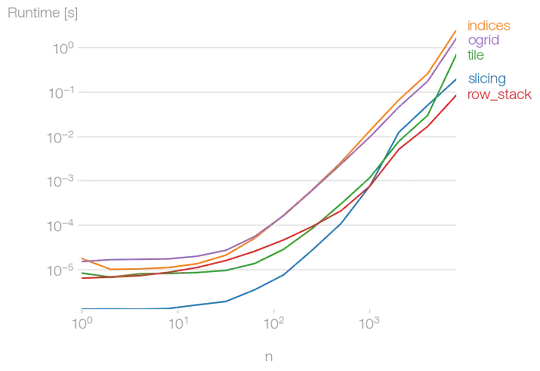
On mbeans I can see there are active connections but on the graph nothing is captured.

JDBC Graph

jdbc graph

MBeans

mbeans

Debugging Logs

Debugging Logs

StackzOfZtuff
  • 2,534
  • 1
  • 28
  • 25
g33kMate
  • 1
  • 1

2 Answers2

0

I suggest that you move the Resource from server.xml to the xml context file of the webapp (conf/Catalina/localhost/MpesaIntegrations.xml) and that you remove the ResourceLink.

So the xml context file of the webapp is like this:

    <?xml version="1.0" encoding="UTF-8" ?>
    <Context>
        <Resource type="javax.sql.DataSource"
        name="jdbc/LocalAPIDB"
        factory="org.apache.tomcat.jdbc.pool.DataSourceFactory"
        driverClassName="com.mysql.jdbc.Driver"
        url="jdbc:mysql://localhost:3306/apiDB"
        username="xxxx"
        password="xxxxx"
        initialSize="340"
        maxActive="3770"
        maxIdle="2330"
        minIdle="890"
        testOnBorrow="true"
        validationQuery="SELECT 1"
        validationInterval="30000"
        timeBetweenEvictionRunsMillis="5000"
        minEvictableIdleTimeMillis="60000"
        removeAbandoned="true"
        removeAbandonedTimeout="60"
        abandonWhenPercentageFull="0"
        logAbandoned="true"
        jdbcInterceptors="org.apache.tomcat.jdbc.pool.interceptor.ConnectionState;org.apache.tomcat.jdbc.pool.interceptor.StatementFinalizer;org.apache.tomcat.jdbc.pool.interceptor.ResetAbandonedTimer"
        />
    </Context>

And/or, if that's not enough, you probably have a listener or filter in your webapp that is getting and keeping in cache the DataSource. In that case, put the javamelody listener and filter near the top of your WEB-INF/web.xml file.

evernat
  • 1,713
  • 13
  • 18
0

For anybody scratching their head trying to find out why JavaMelody won't show database stats such as 'active JDBC connections', I finally solved it by doing 2 things. Note that in my case I'm using Java 11 running Apache Tomcat 9 hosting an Apache Derby 10.15.2 database:

  1. Setting up the database in the 'apache-tomcat-9.0.52\conf\context.xml' file eather than in java code in my webapp. I think this made the database associated with the JNDI resource name so JavaMelody could see it. I added this XML to that context.xml file:
<Resource name="jdbc/DatabaseJNDIResourceName"
    auth="Container" 
    type="javax.sql.DataSource" 
    driverClassName="org.apache.derby.jdbc.EmbeddedDriver" 
    url="jdbc:derby:../DatabaseName;" 
    username="someuser" 
    password="s3cret" 
    />

Then you can get the DataSource in your webapp java code using:

InitialContext initialContextJNDI = new InitialContext();
DataSource dataSource = (DataSource)initialContextJNDI.lookup("java:comp/env/jdbc/DatabaseJNDIResourceName");

Note that a method to detect a potential JNDI resource name problem is to see if the resource name shows up in JavaMelody by navigating to the page 'JNDI tree' at the bottom, linked here http://localhost:8080/monitoring?part=jndi

  1. Inserting the web.xml code referred to here. Interestingly, when that XML code was left out, javamelody would still run but it didn't report JDBC-related data.
<filter>
    <filter-name>javamelody</filter-name>
    <filter-class>net.bull.javamelody.MonitoringFilter</filter-class>
    <async-supported>true</async-supported>
</filter>
<filter-mapping>
    <filter-name>javamelody</filter-name>
    <url-pattern>/*</url-pattern>
    <dispatcher>REQUEST</dispatcher>
    <dispatcher>ASYNC</dispatcher>
</filter-mapping>
<listener>
    <listener-class>net.bull.javamelody.SessionListener</listener-class>
</listener>

Another thing, even after these fixes finally solved the problem and made JavaMelody aware of my database, I didn't immediately notice since the graphs barely change if your database queries are fast. I only confirmed that the database stats were being logged after executing a long SQL query and updating the 'opened jdbc connections' page, linked at the bottom of the javamelody stats page here, which showed one single connection while the database took a few seconds to process the large (1 million row table) query http://localhost:8080/monitoring?part=connections

StackzOfZtuff
  • 2,534
  • 1
  • 28
  • 25
keithphw
  • 380
  • 1
  • 4
  • 14