2

I have a dataframe with 36540 rows. the objective is to predict y HITS_DAY.

#data

https://github.com/soufMiashs/Predict_Hits

enter image description here

I am trying to train a non-linear regression model but model doesn't seem to learn much.

X_train, X_test, y_train, y_test = train_test_split(x, y, test_size=0.20, random_state=42)
data_dmatrix = xgb.DMatrix(data=x,label=y)

xg_reg = xgb.XGBRegressor(learning_rate = 0.1, objectif='reg:linear', max_depth=5,
                          n_estimators = 1000)

xg_reg.fit(X_train,y_train)
preds = xg_reg.predict(X_test)
df=pd.DataFrame({'ACTUAL':y_test, 'PREDICTED':preds})

what am I doing wrong?

SoufianeS
  • 59
  • 1
  • 9
  • can't tell from the sample data you provided. one possibility is that the learning rate is too high, you can try to reduce it – StupidWolf Nov 28 '20 at 19:29
  • @StupidWolf I've reduced the learning rate to 0.001 it gives me almost the same result :/ – SoufianeS Nov 28 '20 at 21:35
  • can you explain the plot above? Is it a qqplot of your observed values? – StupidWolf Nov 28 '20 at 21:48
  • Yes a qqplot of all observed values – SoufianeS Nov 29 '20 at 17:08
  • your values are quite skewed. Would it make sense to take the log or do some kind of transformation? your model would reduce the error on the high values. Also it would help if you define what you mean by "not learning much" . This is incredibly vague – StupidWolf Nov 29 '20 at 17:14
  • Yes I have already tried to transform the data. The features don't explain target y well. The predicted values are far from the real values. If you have another modeling to better predict y I'm a taker. I point out has many values that equals 0 – SoufianeS Nov 29 '20 at 17:22
  • Let us [continue this discussion in chat](https://chat.stackoverflow.com/rooms/225288/discussion-between-soufianes-and-stupidwolf). – SoufianeS Nov 29 '20 at 17:33

1 Answers1

6

You're not doing anything wrong in particular (except maybe the objectif parameter for xgboost which doesn't exist), however, you have to consider how xgboost works. It will try to create "trees". Trees have splits based on the values of the features. From the plot you show here, it looks like there are very few samples that go above 0. So making a test train split random will likely result in a test set with virtually no samples with a value above 0 (so a horizontal line).

Other than that, it seems you want to fit a linear model on non-linear data. Selecting a different objective function is likely to help with this.

Finally, how do you know that your model is not learning anything? I don't see any evaluation metrics to confirm this. Try to think of meaningful evaluation metrics for your model and show them. This will help you determine if your model is "good enough".

To summarize:

  1. Fix the imbalance in your dataset (or at least take it into consideration)
  2. Select an appropriate objective function
  3. Check evaluation metrics that make sense for your model

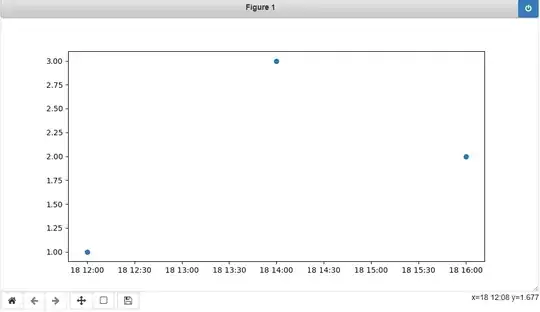
From this example it looks like your model is indeed learning something, even without parameter tuning (which you should do!).

import pandas
import xgboost

from sklearn.model_selection import train_test_split
from sklearn.metrics import mean_squared_error, r2_score

# Read the data
df = pandas.read_excel("./data.xlsx")

# Split in X and y
X = df.drop(columns=["HITS_DAY"])
y = df["HITS_DAY"]

# Show the values of the full dataset in a plot
y.sort_values().reset_index()["HITS_DAY"].plot()

# Split in test and train, use stratification to make sure the 2 groups look similar
X_train, X_test, y_train, y_test = train_test_split(
    X, y, test_size=0.20, random_state=42, stratify=[element > 1 for element in y.values]
)

# Show the plots of the test and train set (make sure they look similar!)
y_train.sort_values().reset_index()["HITS_DAY"].plot()
y_test.sort_values().reset_index()["HITS_DAY"].plot()

# Create the regressor
estimator = xgboost.XGBRegressor(objective="reg:squaredlogerror")

# Fit the regressor
estimator.fit(X_train, y_train)

# Predict on the test set
predictions = estimator.predict(X_test)
df = pandas.DataFrame({"ACTUAL": y_test, "PREDICTED": predictions})

# Show the actual vs predicted
df.sort_values("ACTUAL").reset_index()[["ACTUAL", "PREDICTED"]].plot()

# Show some evaluation metrics
print(f"Mean squared error: {mean_squared_error(y_test.values, predictions)}")
print(f"R2 score: {r2_score(y_test.values, predictions)}")

Output:

y

y_train

y_test

Actual vs predicted

Mean squared error: 0.01525351142868279
R2 score: 0.07857787102063485
Gijs Wobben
  • 1,974
  • 1
  • 10
  • 13
  • Thank you very much for your help. Do you know other SVC, GBM models better adapted to my problem? – SoufianeS Nov 30 '20 at 12:55
  • 1
    @SoufianeS, other models will be more suitable given the nature of your data. Trees are great, but they can struggle a little with continuous features. SVM or NN is likely to perform better. However, the points about the preprocessing (how to split the data) and the evaluation metrics still apply, regardless of the model type. In general: Just try different models on your data and compare the metrics. – Gijs Wobben Nov 30 '20 at 13:38
  • 1
    @SoufianeS, FYI there are a lot of options: https://scikit-learn.org/stable/supervised_learning.html#supervised-learning – Gijs Wobben Nov 30 '20 at 13:41
  • I will then try the other models hoping to have better predictions. Thank you for your time – SoufianeS Nov 30 '20 at 14:18