I'm generating examples with sphinx-gallery, and would like to embed graphviz outputs automatically, similar to how matplotlib figures are captured.
A screenshot of my current progress is below. Notice the captured Out shows string or byte representations of the figures.
I would like the Out to be an image/svg.

I've investigated the following:
graphvizcan export SVG for Jupyter notebooks through a private_repr_svg_()method, butsphinx-galleryinterprets this as a string.sphinx-galleryhas experimental support for "Custom Image Scrapers", but I want to avoid glue code in my examples where I "write image files, then read them back into generated html."- How does
graphvizdocumentation accomplish this? By generating .png figures ahead of time and embedding them with.. image::directives.
Update (2020-11-26): Adding a _repr_html_ that wraps the graphviz's _repr_svg_ method seems like the shortest route. I implemented a rough version:
Here is the code for what I have tried already:
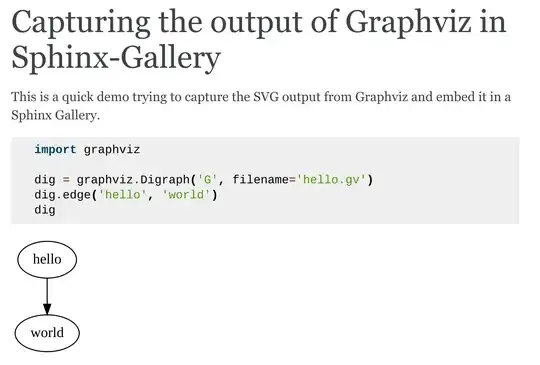
# File: examples/plot_graphviz_svg.py

"""
==================================================
Capturing the output of Graphviz in Sphinx-Gallery
==================================================

This is a quick demo trying to capture the SVG output
from Graphviz and embed it in a Sphinx Gallery.
"""

import graphviz

dig = graphviz.Digraph('G', filename='hello.gv')
dig.edge('hello', 'world')
dig._repr_svg_()

# %%
# The first output should be above, the next should appear below:

dig2 = graphviz.Digraph('G2', filename="hello2.gv")
dig2.edge('world', 'hello')
dig.pipe()
A minimal sphinx conf.py:
project = 'sphinx-graphviz-svg'
copyright = '2020, Alexander L. Hayes'
author = 'Alexander L. Hayes'
release = '0.0.1'
extensions = [
    'sphinx_gallery.gen_gallery',
]
templates_path = ['_templates']
exclude_patterns = []
html_theme = 'alabaster'
html_static_path = ['_static']
And a minimal index.rst linking to an Example Gallery:
Welcome to sphinx-graphviz-svg's documentation!
===============================================

.. toctree::
   :hidden:
   :maxdepth: 1
   :caption: Example Gallery

   auto_examples/index
