When using image-charts with the URL below - only half the graph is being drawn. This used to work a few days ago just fine - did something recently change?
When using image-charts with the URL below - only half the graph is being drawn. This used to work a few days ago just fine - did something recently change?
Missed this important information from the documentation https://documentation.image-charts.com/reference/chart-axis/#custom-axis-labels
Note: Do not place a pipe after the final label in the chxl parameter
In the half graph version, I had one trailing pipe in the chxl parameter:
https://image-charts.com/chart?cht=lc
&chd=t:17.7,17.7,17.6,17.5,17.4,17.3,17.3,17.2,17.1,17.3,17.6,17.4,17.2,17.1,16.9,16.8,16.8,16.7,16.6,16.5,16.4,16.4,16.3,16.3,16.2,16.2,16.1,16.1,16,16,16,16,16,15.9,15.9,15.9,15.9,15.9,15.9,15.9,15.8,15.8,15.8,16.7,16.9,16.6,16.5,16.4,16.2,16.1,16.1,16.1,16,16,16,16,16.6,16.7,16.6,16.5,16.4,16.4,16.4,16.4,16.4,16.6,17.3,17.3,17.2,17.1,17,16.8,16.8,16.7,17,16.9,16.8,16.7,16.6,16.5,16.4,16.3,16.2,16.2,16.3,16.3,16.2,16.2,16.3,16.3,16.3,16.2,16.4,16.3,16.5,16.7|66.6,64.8,62,60.9,60.5,60.7,60.6,60.4,60.4,62.9,61,60.2,60.1,60.2,60.2,60.1,60.1,60.2,60.3,60.3,60.3,60.3,60.5,60.6,60.5,60.6,60.9,60.9,60.9,61.2,61.5,61.6,61.8,62.2,62.4,62.5,62.7,62.7,62.8,62.6,63.2,63,63.1,62.3,62.4,63.9,63.8,63.2,61.8,62.9,64.8,61.5,60.1,58.3,59.7,59.8,62,62.5,59.8,58,56.9,56.3,56.3,56,55.6,59.8,63.1,56.1,53.9,52.7,52,51.4,51.8,52.4,53.2,53.1,53.4,53.8,54.3,54.6,54.9,55.2,55.5,61.7,61.6,59.2,58.8,59.4,61.8,60.2,59.8,59.3,66.7,64.2,74.4,76.3
&chds=a
&chof=.png
&chs=999x800
&chdl=Temperature|Humidity
&chg=20,4
&chco=2196F3,FF5722
&chtt=Temperature Humidity Chart
&chxt=x,y
&chxl=0:|21:15||||22:15||||23:15||||00:15||||01:15||||02:15||||03:15||||04:15||||05:15||||06:15||||07:15||||08:15||||09:15||||10:15||||11:15||||12:15||||13:15||||14:15||||15:15||||16:15||||17:15||||18:15||||19:15||||20:15|
&chls=3|3
&chdlp=b
&chf=bg,s,FFFFFF
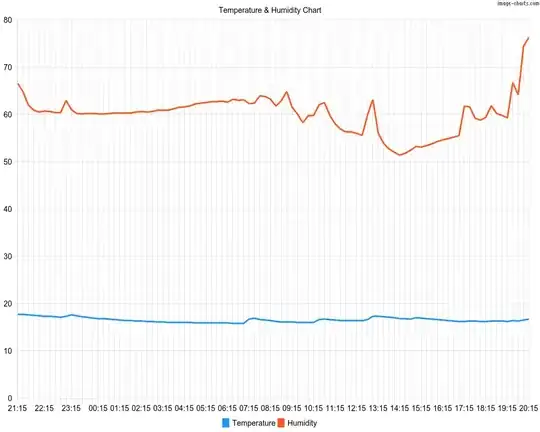
Changing this so there is no trailing pipe in the chxl parameter fixed the issue:
https://image-charts.com/chart?cht=lc
&chd=t:17.7,17.7,17.6,17.5,17.4,17.3,17.3,17.2,17.1,17.3,17.6,17.4,17.2,17.1,16.9,16.8,16.8,16.7,16.6,16.5,16.4,16.4,16.3,16.3,16.2,16.2,16.1,16.1,16,16,16,16,16,15.9,15.9,15.9,15.9,15.9,15.9,15.9,15.8,15.8,15.8,16.7,16.9,16.6,16.5,16.4,16.2,16.1,16.1,16.1,16,16,16,16,16.6,16.7,16.6,16.5,16.4,16.4,16.4,16.4,16.4,16.6,17.3,17.3,17.2,17.1,17,16.8,16.8,16.7,17,16.9,16.8,16.7,16.6,16.5,16.4,16.3,16.2,16.2,16.3,16.3,16.2,16.2,16.3,16.3,16.3,16.2,16.4,16.3,16.5,16.7|66.6,64.8,62,60.9,60.5,60.7,60.6,60.4,60.4,62.9,61,60.2,60.1,60.2,60.2,60.1,60.1,60.2,60.3,60.3,60.3,60.3,60.5,60.6,60.5,60.6,60.9,60.9,60.9,61.2,61.5,61.6,61.8,62.2,62.4,62.5,62.7,62.7,62.8,62.6,63.2,63,63.1,62.3,62.4,63.9,63.8,63.2,61.8,62.9,64.8,61.5,60.1,58.3,59.7,59.8,62,62.5,59.8,58,56.9,56.3,56.3,56,55.6,59.8,63.1,56.1,53.9,52.7,52,51.4,51.8,52.4,53.2,53.1,53.4,53.8,54.3,54.6,54.9,55.2,55.5,61.7,61.6,59.2,58.8,59.4,61.8,60.2,59.8,59.3,66.7,64.2,74.4,76.3
&chds=a
&chof=.png
&chs=999x800
&chdl=Temperature|Humidity
&chg=20,4
&chco=2196F3,FF5722
&chtt=Temperature Humidity Chart
&chxt=x,y
&chxl=0:|21:15||||22:15||||23:15||||00:15||||01:15||||02:15||||03:15||||04:15||||05:15||||06:15||||07:15||||08:15||||09:15||||10:15||||11:15||||12:15||||13:15||||14:15||||15:15||||16:15||||17:15||||18:15||||19:15||||20:15||||21:15
&chls=3|3
&chdlp=b
&chf=bg,s,FFFFFF
Great that I have managed to fix it moving forward but not great for all the hundreds of half charts