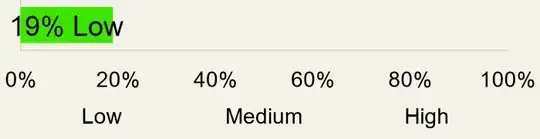
Being a 1-to-1 replacement, why does this code generate such a different bar chart? Going through the image-charts docs, this looks like it should work. I'm having problems getting the text to display next to the chart, as well as displaying the custom x-axis.

Original googleapis code
https://chart.googleapis.com/chart?cht=bhs&chs=250x70&chd=t:19&chco=39e600&chf=bg,s,f3f1e9&chxt=x,x&chm=N**%%20Low,000000,0,-1,18&chxl=1:|Low|Medium|High&chxp=0,0,25,42,100|1,13,34,71&chxs=0N**%,000000
Swapping out to image-charts
https://image-charts.com/chart?cht=bhs&chs=250x70&chd=t:19&chco=39e600&chf=bg,s,f3f1e9&chxt=x,x&chm=N**%%20Low,000000,0,-1,18&chxl=1:|Low|Medium|High&chxp=0,0,25,42,100|1,13,34,71&chxs=0N**%,000000
What's going on here? Tried breaking it down to the smallest possible pieces, but never had any success getting the x-axis or text within the chart to work.
Any ideas?