I am trying to program a visualisation for the Mandelbrot set in java, and there are a couple of things that I am struggling with to program. I realize that questions around this topic have been asked a lot and there is a lot of documentation online but a lot of things seem very complicated and I am relatively new to programming.
The first issue
The first issue I have is to do with zooming in on the fractal. My goal is to make an "infinite" zoom on the fractal (of course not infinite, as far as a regular computer allows it regarding calculation time and precision). The approach I am currently going for is the following on a timer:
- Draw the set using some number of iterations on the range (-2, 2) on the real axis and (2, 2) on the imaginary axis.
- Change those ranges to zoom in.
- Redraw that section of the set with the number of iterations.
It's the second step that I struggle with. This is my current code:
for (int Py = beginY; Py < endY; Py++) {
        for (int Px = beginX; Px < endX; Px++) {
            double x0 = map(Px, 0, height,-2, 2);
            double y0 = map(Py, 0, width, -2, 2);
Px and Py are the coordinates of the pixels in the image. The image is 1000x1000. The map funtion takes a number, in this case Px or Py, with a range of (0, 1000) and devides it evenly over the range (-2, 2), so it returns the corresponding value in that range.
I think that in order to zoom in, I'll have to change the -2 and 2 values by some way in the timer, but whatever I try, it doesn't seem to work. The zoom always ends up slowing down after a while or it will end up zooming in on a part of the set that is in the set, so not the borders. I tried multiplying them by some scale factor every timer tick, but that doesn't really produce the result I was looking for.
Now I have two questions about this issue.
- Is this the right approach to visualizing the set and zooming in(draw, change range, redraw)?
- If it is, how do I zoom in properly on an area that is interesting and that will keep zooming in properly even after running for a minute?
The second issue
Of course when visualizing something, you need to get some actual visual thing. In this case I want to color the set in a way similar to what you see here: (https://upload.wikimedia.org/wikipedia/commons/f/fc/Mandel_zoom_08_satellite_antenna.jpg).
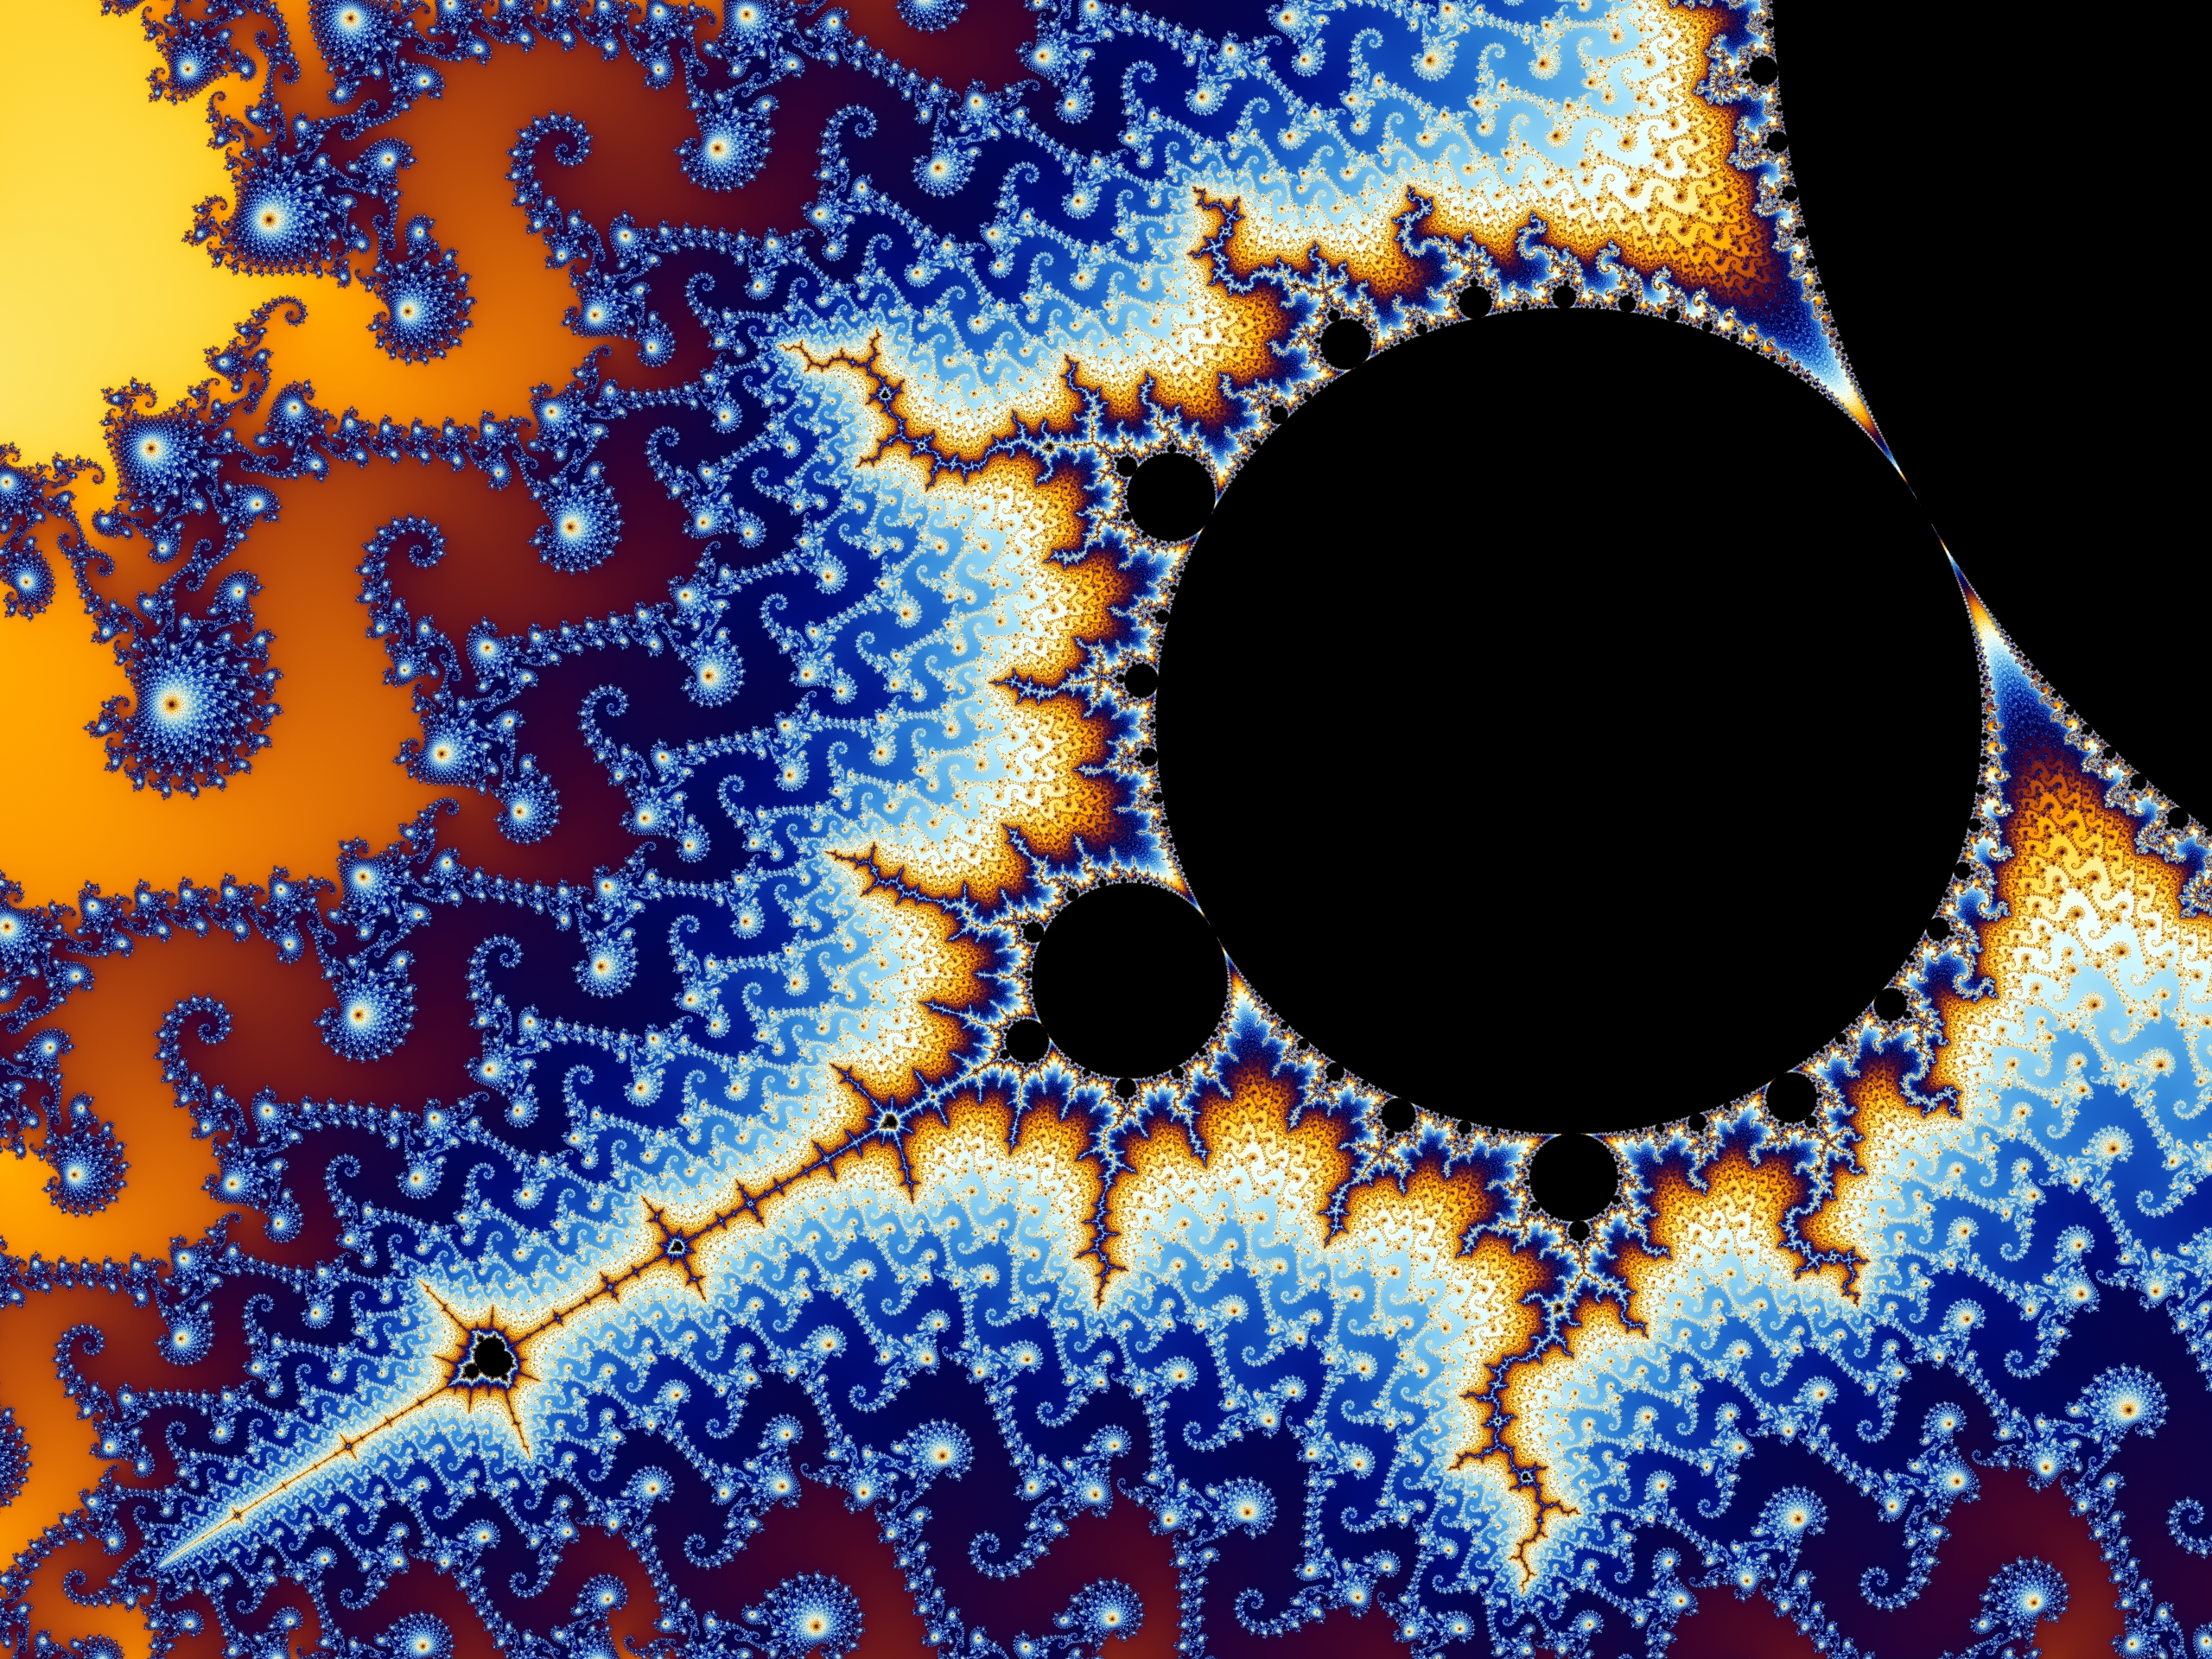
My guess is that you have use the amount of iterations a pixel went through to before breaking out of the loop to give it some color value. However, I only really know how to do this with a black and white color scheme. I tried making a color array that holds the same amount of different gray colors as the amount of max iterations, starting from black and ending in white. Here is my code:
Color[] colors = new Color[maxIterations + 2];
    for (int i = 0; i < colors.length; i++) {
        colors[i] = new Color((int)map(i, 0, maxIterations + 2, 0, 255),
        (int)map(i, 0, maxIterations + 2, 0, 255),
        (int)map(i, 0, maxIterations + 2, 0, 255));
    }
I then just filled in the amount of iterations in the array and assigned that color to the pixel. I have two questions about this:
- Will this also work as we zoom into the fractal in the previously described manner?
- How can I add my own color scheme in this, like in the picture? I've read some things about "linear interpolation" but I don't really understand what it is and in what way it can help me.