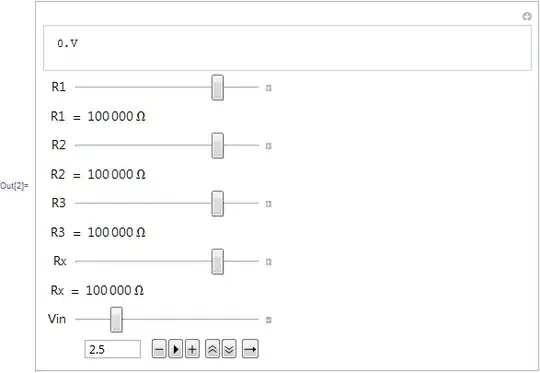
The following code allows you to play with the values in a Wheatstone Bridge. The output appears to the right of the sliders. How do I make the output panel (expr) appear somewhere else and how do I set a fixed size? (I can only find options for manipulating size and position of Controls, not the output in the Manipulate docs.)
Manipulate[
 Evaluate[(10^Rx/(10^R3 + 10^Rx) - 10^R2/(10^R1 + 10^R2))*Vin] "V",
 {{R1, 5}, 1, 6, 0.01},
 Pane["R1  = " Dynamic[Round[10^R1] "\[CapitalOmega]"],
  ImageMargins -> {{2.5, 0}, {3, 0}}], {{R2, 5}, 1, 6, 0.01},
 Pane["R2  = " Dynamic[Round[10^R2] "\[CapitalOmega]"],
  ImageMargins -> {{2.5, 0}, {3, 0}}], {{R3, 5}, 1, 6, 0.01},
 Pane["R3  = " Dynamic[Round[10^R3] "\[CapitalOmega]"],
  ImageMargins -> {{2.5, 0}, {3, 0}}],
 {{Rx, 5}, 1, 6, 0.01},
 Pane["Rx  = " Dynamic[Round[10^Rx] "\[CapitalOmega]"],
  ImageMargins -> {{2.5, 0}, {3, 0}}],
 {{Vin, 2.5}, 0, VMax, Appearance -> "Open"}]