1

I have this data:

values

data2 is missing the third point. So I thought, I'd define two different x columns and assign data2 to x2.

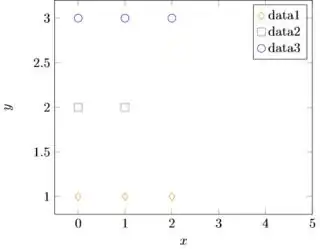
Problem: the third point of data1 goes up to 3 in the compiled graphic. If I have different and more values, points start to go anywhere, but not where they belong.

That is the code I've used:

\addplot[only marks, mark = diamond, color = orange, mark size = 3pt]
 table[x=x1, y=data1]{example.dat};
\addlegendentry{data1};

\addplot[only marks, mark = square, color = gray, mark size = 3pt]
 table[x=x2, y=data2]{example.dat};
\addlegendentry{data2};

\addplot[only marks, mark = o, color = blue, mark size = 3pt]
 table[x=x1, y=data3]{example.dat};
\addlegendentry{data3};

And this is the graph I get:

graph

Thanks a lot!

Btw. in the real data one data set is missing a x/y value in the middle of the data. I hope that doesn't matter compared to my example.

pchaigno
  • 11,313
  • 2
  • 29
  • 54
Sophie
  • 13
  • 1
  • 5

1 Answers1

1

pgfplots is interpreting 2 tabs as a single separator. Thus, it sees the data file as:

x1  x2  data1   data2   data3
0   0   1   2   3
1   1   1   2   3
2   1   3

Solution 1. You can replace empty cells with NaN. pgfplots will interpret this correctly:

x1  x2  data1   data2   data3
0   0   1   2   3
1   1   1   2   3
2   nan 1   nan 3

Solution 2. Use another type of separator (e.g., semicolons or commas):

\begin{filecontents*}{example.csv}
x1;x2;data1;data2;data3
0;0;1;2;3
1;1;1;2;3
2;;1;;3
\end{filecontents*}
\pgfplotstableread[col sep = semicolon]{example.csv}\mydata

\begin{document}
...

Here I've included the data file in the TeX file, but it should also work with a separate data file.


enter image description here

pchaigno
  • 11,313
  • 2
  • 29
  • 54