2

I have 2 images ("before" and "after"). I would like to show a final image where the left half is taken from the before image and the right half is taken from the after image.

The images should be separated by a white diagonal line of predefined width (2 or 3 pixels), where the diagonal is specified either by a certain angle or by 2 start and end coordinates. The diagonal should overwrite a part of the final image such that the size is the same as the sources'.

Example:

Example merged image

I know it can be done by looping over all pixels to recombine and create the final image, but is there an efficient way, or better yet, a built-in function that can do this?

Dev-iL
  • 23,742
  • 7
  • 57
  • 99
Stack Player
  • 1,470
  • 2
  • 18
  • 32
  • 1
    So you want an image where it's decomposed into three parts... the first part is the left half of the before image, the middle is an image of a white line that is 2 or 3 pixels wide but rotated at some angle and the last part is the right half of the after image? Would it be possible to show an example? – rayryeng Jun 01 '17 at 14:37
  • Yes definitely, I have added an example in my edit. – Stack Player Jun 01 '17 at 14:39
  • Aha. That example explains it all. Thanks for adding it. Do you have the image processing toolbox by chance? – rayryeng Jun 01 '17 at 14:40
  • 1
    Should the white line overwrite part of the image resulting in a same-sized image or move them apart? – Leander Moesinger Jun 01 '17 at 14:41
  • 1
    @rayreng yes I do, Leander it should overwrite so that the final image size is the same as the original 2 images – Stack Player Jun 01 '17 at 14:44
  • @StackPlayer Awesome. OK, give me a moment to write something. – rayryeng Jun 01 '17 at 14:45

3 Answers3

5

Unfortunately I don't believe there is a built-in solution to your problem, but I've developed some code to help you do this but it will unfortunately require the image processing toolbox to play nicely with the code. As mentioned in your comments, you have this already so we should be fine.

The logic behind this is relatively simple. We will assume that your before and after pictures are the same size and also share the same number of channels. The first part is to declare a blank image and we draw a straight line down the middle of a certain thickness. The intricacy behind this is to declare an image that is slightly bigger than the original size of the image. The reason why is because I'm going to draw a line down the middle, then rotate this blank image by a certain angle to achieve the first part of what you desire. I'll be using imrotate to rotate an image by any angle you desire. The first instinct is to declare an image that's the same size as either the originals, draw a line down the middle and rotate it. However, if you do this you'll end up with the line being disconnected and not draw from the top to the bottom of the image. That makes sense because the line being drawn on an angle covers more pixels than if you were to draw this vertically.

Using Pythagorean's theorem, we know that the longest line that can ever be drawn on your image is the diagonal. Therefore we declare an image that is sqrt(rows*rows + cols*cols) in both the rows and columns where rows and cols are the rows and columns of the original image. After, we'll take the ceiling to make sure we've covered as much as possible and we add a bit of extra room to accommodate for the width of the line. We draw a line on this image, rotate it then we'll crop the image after so that it's the same size as the input images. This ensures that the line drawn at whatever angle you wish is fully drawn from top to bottom.

That logic is the hardest part. Once you do that, you declare two logical masks where you use imfill to fill the left side of the mask as one mask and we'll invert the mask to find the other mask. You will also need to use the line image that we created earlier with imrotate to index into the masks and set the values to false so that we ignore these pixels that are on the line.

Finally, you take each mask, index into your image and copy over each portion of the image you desire. You finally use the line image to index into the output and set the values to white.

Without further ado, here's the code:

% Load some example data
load mandrill;

% im is the image before
% im2 is the image after
% Before image is a colour image
im = im2uint8(ind2rgb(X, map));

% After image is a grayscale image
im2 = rgb2gray(im);
im2 = cat(3, im2, im2, im2);

% Declare line image
rows = size(im, 1); cols = size(im, 2);
width = 5;
m = ceil(sqrt(rows*rows + cols*cols + width*width));
ln = false([m m]);
mhalf = floor(m / 2); % Find halfway point width wise and draw the line
ln(:,mhalf - floor(width/2) : mhalf + floor(width/2)) = true;

% Rotate the line image
ang = 20; % 20 degrees
lnrotate = imrotate(ln, ang, 'crop');

% Crop the image so that it's the same dimensions as the originals
mrowstart = mhalf - floor(rows/2);
mcolstart = mhalf - floor(cols/2);
lnfinal = lnrotate(mrowstart : mrowstart + rows - 1, mcolstart : mcolstart + cols - 1);

% Make the masks
mask1 = imfill(lnfinal, [1 1]);
mask2 = ~mask1;
mask1(lnfinal) = false;
mask2(lnfinal) = false;

% Make sure the masks have as many channels as the original
mask1 = repmat(mask1, [1 1 size(im,3)]);
mask2 = repmat(mask2, [1 1 size(im,3)]);

% Do the same for the line
lnfinal = repmat(lnfinal, [1 1 size(im, 3)]);

% Specify output image
out = zeros(size(im), class(im));
out(mask1) = im(mask1);
out(mask2) = im2(mask2);
out(lnfinal) = 255;

% Show the image
figure;
imshow(out);

We get:

enter image description here

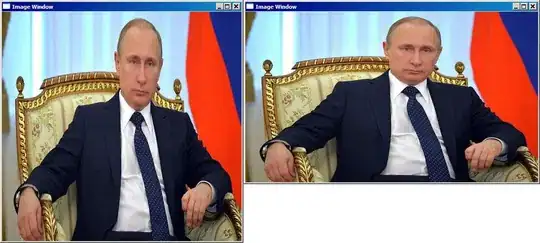
If you want the line to go in the other direction, simply make the angle ang negative. In the example script above, I've made the angle 20 degrees counter-clockwise (i.e. positive). To reproduce the example you gave, specify -20 degrees instead. I now get this image:

enter image description here

rayryeng
  • 102,964
  • 22
  • 184
  • 193
  • I am getting an error with the zeros function:Error using zeros CLASSNAME input must be a valid numeric class name. I think the input string 'logical' is not supported. – Stack Player Jun 01 '17 at 15:32
  • @StackPlayer You're probably using an older version of MATLAB. It works for R2016b. I've changed it so that it works for older versions. – rayryeng Jun 01 '17 at 15:34
  • Yes 2015b, and it works now thank you! I had tried changing to uint8 but it made a mess. – Stack Player Jun 01 '17 at 15:36
  • 1
    @StackPlayer Haha no problem :) Thanks for the accept! This was an interesting question. First time I've ever done something like this. – rayryeng Jun 01 '17 at 15:37
  • One thing I noticed, around 45 degrees the image positions (left vs right) flip. But it's just a detail.. And at 45 degrees one of the images is blacked out. – Stack Player Jun 01 '17 at 16:26
  • Ahh yeah that makes sense. 45 degrees is when we're approaching the largest line we can draw. I'd just add additional padding to the line image. Give me a little bit to modify and I'll test it. – rayryeng Jun 01 '17 at 16:40
  • 1
    @StackPlayer OK, I've fixed it. I've just added a bit more padding to the line image before cropping. Let me know if it works. – rayryeng Jun 01 '17 at 16:43
  • 1
    A great one, as always, ray! – Ander Biguri Jun 02 '17 at 07:51
  • @AnderBiguri Thank you, as always :) – rayryeng Jun 02 '17 at 08:16
3

Here's a solution using polygons:

function q44310306
% Load some image:
I = imread('peppers.png');
B = rgb2gray(I);
lt = I; rt = B;
% Specify the boundaries of the white line:
width = 2; % [px]
offset = 13; % [px]
sz = size(I);
wlb = [floor(sz(2)/2)-offset+[0,width]; ceil(sz(2)/2)+offset-[width,0]];
%      [top-left, top-right;              bottom-left, bottom-right]
% Configure two polygons:
leftPoly  = struct('x',[1 wlb(1,2) wlb(2,2) 1],        'y',[1 1 sz(1) sz(1)]);
rightPoly = struct('x',[sz(2) wlb(1,1) wlb(2,1) sz(2)],'y',[1 1 sz(1) sz(1)]);
% Define a helper grid:
[XX,YY] = meshgrid(1:sz(2),1:sz(1));
rt(inpolygon(XX,YY,leftPoly.x,leftPoly.y)) = intmin('uint8');
lt(repmat(inpolygon(XX,YY,rightPoly.x,rightPoly.y),1,1,3)) = intmin('uint8');
rt(inpolygon(XX,YY,leftPoly.x,leftPoly.y) & ...
   inpolygon(XX,YY,rightPoly.x,rightPoly.y)) = intmax('uint8');
final = bsxfun(@plus,lt,rt);
% Plot:
figure(); imshow(final);

The result:

enter image description here

Dev-iL
  • 23,742
  • 7
  • 57
  • 99
2

One solution:

im1 = imread('peppers.png');
im2 = repmat(rgb2gray(im1),1,1,3);

imgsplitter(im1,im2,80) %imgsplitter(image1,image2,angle [0-100])

function imgsplitter(im1,im2,p)
    s1  = size(im1,1); s2 = size(im1,2);
    pix = floor(p*size(im1,2)/100);
    val = abs(pix -(s2-pix));
    dia = imresize(tril(ones(s1)),[s1 val]);
    len = min(abs([0-pix,s2-pix]));
    if p>50
        ind = [ones(s1,len) fliplr(~dia) zeros(s1,len)];
    else
        ind = [ones(s1,len) dia zeros(s1,len)];
    end
    ind = uint8(ind);
    imshow(ind.*im1+uint8(~ind).*im2)
    hold on 
    plot([pix,s2-pix],[0,s1],'w','LineWidth',1)
end

OUTPUT: enter image description here

obchardon
  • 10,614
  • 1
  • 17
  • 33