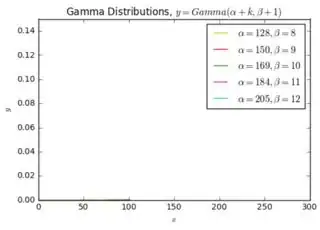
I made 5 gamma plots and the last one, Gamma(100,7) is cut off. Using the same code, I also made 5 more gamma plots (Gamma(128,8), Gamma(150,9), Gamma(169,10), Gamma(184,11), Gamma(205, 12)) and none of them show up. How do I fix this?
Jupyter notebook cell 1:
import numpy as np
import scipy.stats as stats
from matplotlib import pyplot as plt

x = np.linspace (0, 100, 200)
y1 = stats.gamma.pdf(x, a=29, loc=3) #a is alpha, loc is beta
y2 = stats.gamma.pdf(x, a=45, loc=4)
y3 = stats.gamma.pdf(x, a=65, loc=5)
y4 = stats.gamma.pdf(x, a=80, loc=6)
y5 = stats.gamma.pdf(x, a=100, loc=7) #CUT OFF
plt.plot(x, y1, "y-", label=(r'$\alpha=29, \beta=3$'))
plt.plot(x, y2, "r-", label=(r'$\alpha=45, \beta=4$'))
plt.plot(x, y3, "g-", label=(r'$\alpha=65, \beta=5$'))
plt.plot(x, y4, "m-", label=(r'$\alpha=80, \beta=6$'))
plt.plot(x, y5, "c-", label=(r'$\alpha=100, \beta=7$'))

plt.ylim([0,0.08])
plt.xlim([0,150])
plt.show()
Jupyter notebook cell 2:
import numpy as np
import scipy.stats as stats
from matplotlib import pyplot as plt

x = np.linspace (0, 100, 200) #start, stop, num of samples
y6 = stats.gamma.pdf(x, a=128, loc=8) #a is alpha, b is loc
y7 = stats.gamma.pdf(x, a=150, loc=9)
y8 = stats.gamma.pdf(x, a=169, loc=10)
y9 = stats.gamma.pdf(x, a=184, loc=11)
y10 = stats.gamma.pdf(x, a=205, loc=12)
plt.plot(x, y6, "y-", label=(r'$\alpha=128, \beta=8$'))
plt.plot(x, y7, "r-", label=(r'$\alpha=150, \beta=9$'))
plt.plot(x, y8, "g-", label=(r'$\alpha=169, \beta=10$'))
plt.plot(x, y9, "m-", label=(r'$\alpha=184, \beta=11$'))
plt.plot(x, y10, "c-", label=(r'$\alpha=205, \beta=12$'))

plt.ylim([0,0.15])
plt.xlim([0,300])
plt.xlabel(r'$x$')
plt.ylabel(r'$y$')
plt.title('Gamma Distributions, ' + r'$y=Gamma(\alpha + k, \beta + 1)$')
plt.legend(loc='best')
plt.show()
Plot 1
Plot 2

