A terrible solution compared to @Axeman's (but more fun) is to apply a rotational transformation matrix to the data.
To understand what kind of transformation we need, I plotted only the diagonal (value=1) points on a 3D scatter plot.


The rotational matrix about the z (value) axis
Including the added constant, the final equation is

There is probably a better way to vectorize this transformation, but this is how I did it.
rot_m <- matrix(c(0,-1,0,1,0,0,0,0,1),3,3)
ftransform <- function(x){
t(rot_m %*% as.numeric(matrix(m[x,],3,1)) + matrix(c(0,11,0),3,1))
}
foo <- lapply(1:nrow(m),ftransform)
foo <- data.frame(do.call(rbind,foo))
names(foo) <- c("Var1","Var2","value")
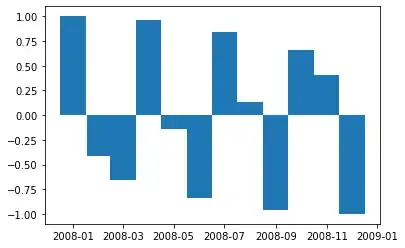
ggplot(foo, aes(Var1,Var2,fill=value)) +
geom_tile()
EDIT: Apologies about the weird image format/layout.

