40

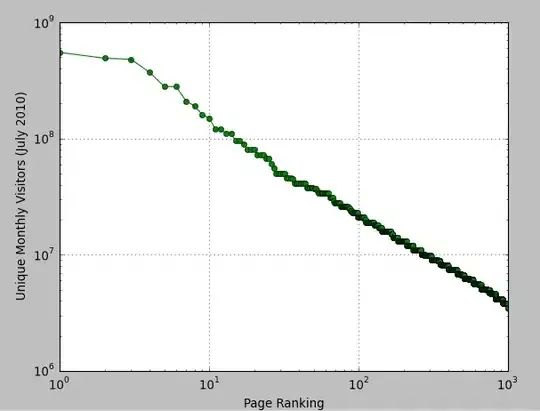
I'm trying to plot a log-log graph that shows logarithmically spaced grid lines at all of the ticks that you see along the bottom and left hand side of the plot. I've been able to show some gridlines by using matplotlib.pyplot.grid(True), but this is only showing grid lines for me at power of 10 intervals. So as an example, here is what I'm currently getting:

Alt text

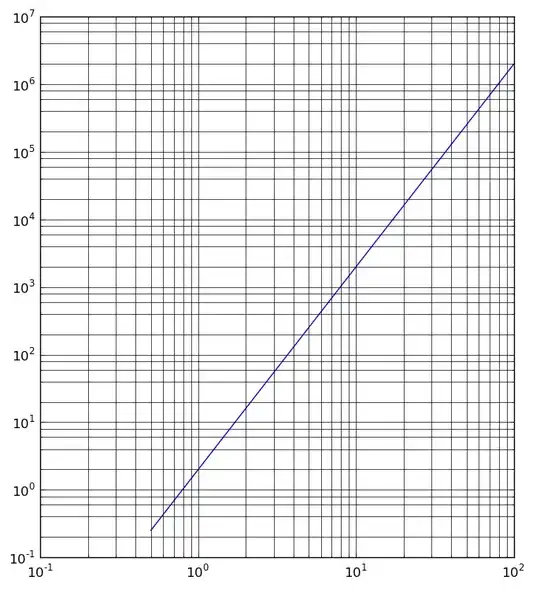
I'd really like something with grid lines looking more like this, where the gridlines aren't all evenly spaced:

Alt text

How would I go about achieving this in Matplotlib?

Peter Mortensen
  • 30,738
  • 21
  • 105
  • 131
Bryce Thomas
  • 10,479
  • 26
  • 77
  • 126

2 Answers2

61

Basically, you just need to put in the parameter which="both" in the grid command so that it becomes:

matplotlib.pyplot.grid(True, which="both")

Other options for which are 'minor' and 'major' which are the major ticks (which are shown in your graph) and the minor ticks which you are missing. If you want solid lines then you can use ls="-" as a parameter to grid() as well.

Here is an example for kicks:

import numpy as np
from matplotlib import pyplot as plt

x = np.arange(0, 100, .5)
y = 2 * x**3

plt.loglog(x, y)
plt.grid(True, which="both", ls="-")
plt.show()

which generates:

a log-log graph

More details on the Matplotlib Docs

Pablo Navarro
  • 8,244
  • 2
  • 43
  • 52
Justin Peel
  • 46,722
  • 6
  • 58
  • 80
  • 2
    I've found that on my machine using "both" results in neither major or minor grid lines being shown. With some googling, I found this post: http://www.mailinglistarchive.com/html/matplotlib-users@lists.sourceforge.net/2010-06/msg00174.html which seems to suggest that older versions of matplotlib require using "majorminor" instead of "both". Do you know whether there is any official documentation of this change between versions? I've looked at http://matplotlib.sourceforge.net/api/api_changes.html, but there doesn't seem to be any mention of it... – Bryce Thomas Aug 28 '10 at 17:28
  • @Bryce I have no idea when that change went into effect. I generally just use the newest version. I'm actually not all that proficient with matplotlib. – Justin Peel Aug 28 '10 at 17:30
  • looking at one of those messages makes me think that it happened on June 9 of 2010. I'm not sure what version that would be, but it was quite recent. – Justin Peel Aug 28 '10 at 18:37
  • Minor grid lines make a figure look very crowded. Alternatively, you could just try increasing your major-minor x/y tick sizes your in matplotlibrc file. – Gökhan Sever Aug 28 '10 at 18:50
  • 1
    @Gokan I agree to some extent, though I've found if you use dotted rather than solid lines the grid is less invasive. – Bryce Thomas Aug 29 '10 at 05:20
  • Thanks! this worked for me. I found that dotted style, in grey with a little bit of transparency works best. – Mehdi Rezaie Mar 10 '20 at 22:23
  • @JustinPeel I have values from 10**8 to 10**17 and still miss the minor grid lines on the y axis. – Alexander Cska Jul 03 '23 at 08:52
9

As @Bryce says, in older version of matplotlib correct kwarg is which=majorminor. I think that solid lines with a lighter color can be better than the dotted lines.

plt.grid(True, which="majorminor", ls="-", color='0.65')

Note that in the latest version of matplotlib this argument is replaced by 'both'.

plt.grid(True, which="both", ls="-", color='0.65')
Pablo Navarro
  • 8,244
  • 2
  • 43
  • 52