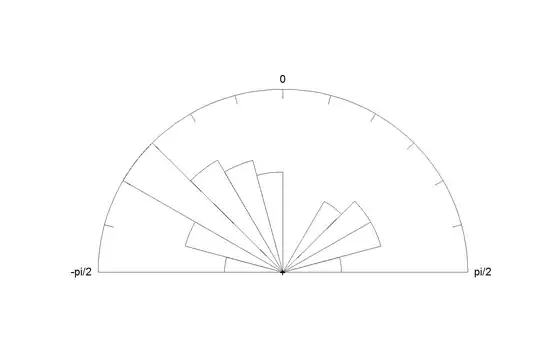
I am plotting a distribution of angles with the rose.diag function from the circular library. Input data are radiants. My MWE code is
    library(circular);
    dat<-read.csv(file.choose(),header=F);
    data=unlist(dat);
    rose.diag(data, bins=24)
I'm interested in showing only part of the data, from -pi/2 to pi/2, and that the length of the biggest tick equals the length of the radius of the circle as show here:

Any help would be appreciated!
EDIT
As suggested by #lawyeR here is the code with a sample of the data:
    library(circular);
    data<- c(-0.188,-0.742,-0.953,-0.948,-0.953,-1.187,-0.9327200,-0.855,-  0.024,1.303,-1.041,-1.068,-1.066,1.442,1.150,0.965,0.665,0.649,0.984,-1.379,-0.584,-0.573,-0.357,-0.237,-0.287,-0.486,-0.783,-0.298,0.849,1.088,-1.003,-0.952,-0.776,-0.811,-0.880);
    rose.diag(data, bins=24);

