I've got a Shiny app that works fine, but the selectInput values don't work when there are more than one to choose from.
The Shiny works with this in mind:
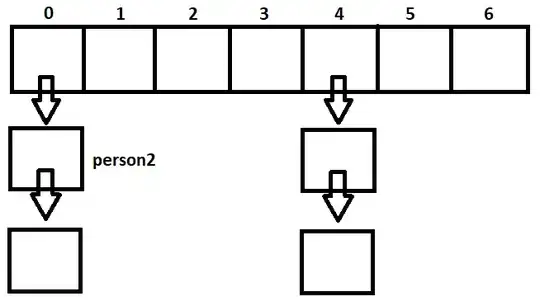
1) Pick a student
2) Pick a date that student took a test
3) Find the student's age
4) Plot the student's score against a cohort of similarly aged people who took the test in the past.
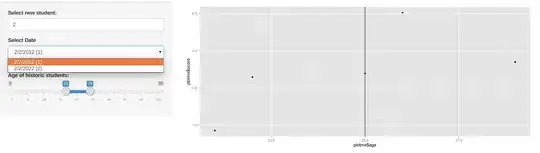
The app looks like this:
It works fine, but after the selectInput (aka dropdown) is created and the slider is adjusted for age, it won't fire when there is more than one choice:
The problem is that I don't know where to put the input$dates in order to select the ID.
I've had some similar issues here and here before but this is a new one.
EDIT ##
For anyone who got here via Google or whatnot, I just want to say that @Andriy Tkachenko's answer below is a great working example that can be expanded for whatever project you are working on. Assuming that your project may require selecting rows where there are multiple IDs and each of these IDs had a corresponding date.
app.R
library('shiny')
library('plyr')
library('ggplot2')
library('data.table')

server <- function(input, output, session) {

  output$distPlot <- renderPlot({
    plotme <<- subset_historic_students()
    p <- ggplot(data=plotme, aes(x=plotme$age, y=plotme$score))+ geom_point()
    my_cust_age <- data.frame(get_selected_student())
    p <- p + geom_vline(data=my_cust_age, aes(xintercept=age))
    print(p)
  })

  new_students <- data.frame(id=c(1,2,2,3), date=c('1/1/2011', '2/2/2012', '2/2/2022', '3/3/2013'), age=c(15, 25, 35, 45), score=c(-0.80,  0.21, 1.0, -0.07))
  new_students$date <- as.character(new_students$date)
  historic_students <- data.frame(age=c(11,12,15,16,19,21,22,25,26,29,31,32,35,36,39,41,42,45,46,49), score=(rnorm(20)))


  # we must deal with the fact that Shiny barfs on duplicates.
  # we need to append a visit number (eg,  'C1)' ) to the end of the `date` string.
  DT_new_students <- data.table(new_students)
  DT_new_students[, .id := sequence(.N), by = "id"]
  new_students$date <- paste(new_students$date, '   (', DT_new_students$.id, ')', sep='')


  get_selected_student <- reactive({student <- new_students[which(new_students$id==input$id), ]
                          return(student[1,])})

  output$dates<-renderUI({
    print("HI")
    selectInput('dates', 'Select Date', choices=new_students[which(new_students$id ==  get_selected_student()$id), ]$date, selected=new_students[which(new_students$id ==  get_selected_student()$id), ]$date, selectize = FALSE)
                          })

  ## age text output
  output$print_age <- renderText({
    selected_student <- get_selected_student()
    if (is.numeric((selected_student[1, 'age'])) &&
          !is.na((selected_student[1, 'age']))){
      paste("Age of selected student: ", selected_student[1, 'age'])
    }
  })

  subset_historic_students <- reactive({
    DF <- historic_students[which((input$age[1] <= historic_students$age) & (input$age[2] >= historic_students$age)), ]
    return(DF)
    })

# this observe block will reset the upper and lower values for the Select Age slider
    observe({
      new_cust <- get_selected_student()

      new_min <- round_any(new_cust$age, 10, floor)
      new_max <- new_min+9

      if(is.na(new_min)){  # before any PIDN is selected, the observe still runs. Thus we needed to prevent an NA here, which was appearing on the lower bound of the slider.
        new_min <- min_age
      }
      if(is.na(new_max)){
        new_max <- max_age
      }
      updateSliderInput(session, "age", value = c(new_min, new_max))
                       })

}


ui <- fluidPage( headerPanel(title = ""),
  sidebarLayout(
    sidebarPanel(
      numericInput(inputId="id", label="Select new student:", value=1),
      uiOutput("dates"),
      textOutput("print_age"),
      sliderInput(inputId="age", "Age of historic students:", min=0, max = 55, value=c(18, 100), step=1, ticks=TRUE)
    ),
    mainPanel(plotOutput("distPlot"))
  )
)

shinyApp(ui = ui, server = server)