0

I recently started using achartengine 1.2.0 for new type of chart, the HEAP one. It works great in general but I've found a one issue with the way the chart handles zero values in series. I do have a chart with 7 bars (each bar is one day of week) and multiple series. I noticed that values in series which are equall to zero are still rendered on chart as a tiny line. Here's the screenshot:

enter image description here

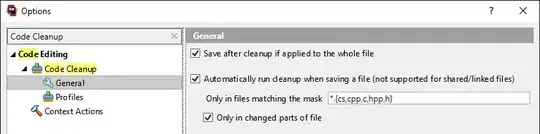
How I can get rid of those lines?

trincot
  • 317,000
  • 35
  • 244
  • 286
shadovraven
  • 36
  • 1
  • 6

1 Answers1

1

You can try adding MathHelper.NULL_VALUE insted of the zero values.

Dan D.
  • 32,246
  • 5
  • 63
  • 79
  • I tried that but sadly that havent't fixed the issue. The lines are still there, altough they seem to be different, looks likes there's more of them when using MathHelper.NULL_VALUE. I tried slightly different solution hovewer and it seems to works but I have to verify that series are displayed correctly. I used -1 instead of zero and the lines are gone. EDIT: When using -1 series are not displayed correctly. Here's the image, do you have any other idea? – shadovraven Sep 10 '14 at 20:15