3

I am trying to get the PSD of a real data set by making use of fftw3 library To test I wrote a small program as shown below ,that generates the a signal which follows sinusoidal function

#include <stdio.h>
#include <math.h>
#define PI 3.14

int main (){
    double  value= 0.0;
    float frequency = 5;
    int i = 0 ; 
    double time = 0.0;
    FILE* outputFile = NULL;
    outputFile = fopen("sinvalues","wb+");
    if(outputFile==NULL){
        printf(" couldn't open the file \n");
        return -1;
    }

    for (i = 0; i<=5000;i++){

        value =  sin(2*PI*frequency*zeit);
        fwrite(&value,sizeof(double),1,outputFile);
        zeit += (1.0/frequency);
    }
    fclose(outputFile);
    return 0;

}

Now I'm reading the output file of above program and trying to calculate its PSD like as shown below

#include <stdio.h>
#include <fftw3.h>
#include <complex.h>
#include <stdlib.h>
#include <math.h>
#define PI 3.14
int main (){
    FILE* inp = NULL;
    FILE* oup = NULL;
    double* value;// = 0.0;
    double* result;
    double spectr = 0.0 ;
    int windowsSize =512;
    double  power_spectrum = 0.0;
    fftw_plan plan;

    int index=0,i ,k;
    double multiplier =0.0;
    inp = fopen("1","rb");
    oup = fopen("psd","wb+");

    value=(double*)malloc(sizeof(double)*windowsSize);
    result = (double*)malloc(sizeof(double)*(windowsSize)); // what is the length that I have to choose here ? 
        plan =fftw_plan_r2r_1d(windowsSize,value,result,FFTW_R2HC,FFTW_ESTIMATE);

    while(!feof(inp)){

        index =fread(value,sizeof(double),windowsSize,inp);
            // zero padding 
        if( index != windowsSize){
            for(i=index;i<windowsSize;i++){
                    value[i] = 0.0;
                        }

        }


        // windowing  Hann 

        for (i=0; i<windowsSize; i++){
            multiplier = 0.5*(1-cos(2*PI*i/(windowsSize-1)));
            value[i] *= multiplier;
        }


        fftw_execute(plan);


        for(i = 0;i<(windowsSize/2 +1) ;i++){ //why only tell the half size of the window
            power_spectrum = result[i]*result[i] +result[windowsSize/2 +1 -i]*result[windowsSize/2 +1 -i];
            printf("%lf \t\t\t %d \n",power_spectrum,i);
            fprintf(oup," %lf \n ",power_spectrum);
        }

    }
    fclose(oup);
    fclose(inp);
    return 0;

}

Iam not sure about the correctness of the way I am doing this, but below are the results i have obtained:

PSD

Can any one help me in tracing the errors of the above approach

Thanks in advance *UPDATE after hartmut answer I'vve edited the code but still got the same result : PSD2

and the input data look like :

sinus

UPDATE 
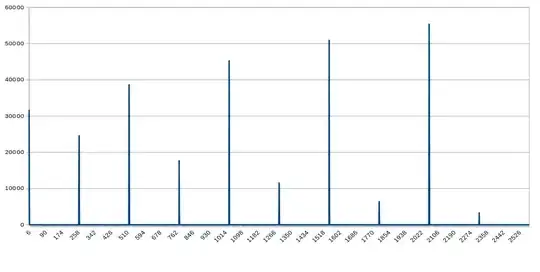
after increasing the sample frequencyand a windows size of 2048 here is what I've got : enter image description here UPDATE after using the ADD-ON here how the result looks like using the window : enter image description here

Engine
  • 5,360
  • 18
  • 84
  • 162
  • In the first program you seem to declare `time` and use `zeit`. This should not compile, unless your compilers knows german. – Jakub Jul 11 '14 at 11:14
  • no I just change the variable name for SO – Engine Jul 11 '14 at 11:29
  • @Engine You are opening "sinvalues" in read mode ( rb ) and doing fwrite on it. Shouldn't you be using "wb" while doing fopen? – Icarus3 Jul 11 '14 at 11:59
  • I rewrote the program and I forgot to correct this my the sinvalues are correct thanks – Engine Jul 11 '14 at 12:09
  • How much did you 'rewrite'? As posted, it is generating a sin at the sampling rate (which is identically 0 if the initial phase is 0). I'd expect `value=sin(2*PI*frequency*time)` and `time += (1.0/samplingrate)` to get a tone with controllable frequency. – SleuthEye Jul 11 '14 at 12:41

3 Answers3

4

You combine the wrong output values to power spectrum lines. There are windowsSize / 2 + 1 real values at the beginning of result and windowsSize / 2 - 1 imaginary values at the end in reverse order. This is because the imaginary components of the first (0Hz) and last (Nyquist frequency) spectral lines are 0.

int spectrum_lines = windowsSize / 2 + 1;
power_spectrum = (double *)malloc( sizeof(double) * spectrum_lines );

power_spectrum[0] = result[0] * result[0];
for ( i = 1 ; i < windowsSize / 2 ; i++ )
    power_spectrum[i] = result[i]*result[i] + result[windowsSize-i]*result[windowsSize-i];
power_spectrum[i] = result[i] * result[i];

And there is a minor mistake: You should apply the window function only to the input signal and not to the zero-padding part.

ADD-ON:

Your test program generates 5001 samples of a sinusoid signal and then you read and analyse the first 512 samples of this signal. The result of this is that you analyse only a fraction of a period. Due to the hard cut-off of the signal it contains a wide spectrum of energy with almost unpredictable energy levels, because you not even use PI but only 3.41 which is not precise enough to do any predictable calculation.

You need to guarantee that an integer number of periods is exactly fitting into your analysis window of 512 samples. Therefore, you should change this in your test signal creation program to have exactly numberOfPeriods periods in your test signal (e.g. numberOfPeriods=1 means that one period of the sinoid has a period of exactly 512 samples, 2 => 256, 3 => 512/3, 4 => 128, ...). This way, you are able to generate energy at a specific spectral line. Keep in mind that windowSize must have the same value in both programs because different sizes make this effort useless.

#define PI 3.141592653589793 // This has to be absolutely exact!

int windowSize = 512;        // Total number of created samples in the test signal
int numberOfPeriods = 64;    // Total number of sinoid periods in the test signal
for ( n = 0 ; n < windowSize ; ++n ) {
    value = sin( (2 * PI * numberOfPeriods * n) / windowSize );
    fwrite( &value, sizeof(double), 1, outputFile );
}
Hartmut Pfitzinger
  • 2,304
  • 3
  • 28
  • 48
  • windowsSize is 512 why do you need spectrum_line ? – Engine Jul 11 '14 at 12:22
  • I don't need it. It's only useful to make the number of spectral lines absolutely clear. You can skip it. It's just because you asked in a comment of your program "why only tell the half size of the window". That's the reason. – Hartmut Pfitzinger Jul 11 '14 at 12:24
  • after changing the code I still get a similar result – Engine Jul 11 '14 at 12:32
  • any Idea why I get this result ? what I'm doing wrong – Engine Jul 11 '14 at 13:06
  • 1
    Please update the test signal creation program. You are creating 5000 values of a frequency 5 which means nothing. And you are reading the first 512 values of it. So, you can't expect that there is an integer number of periods inside these 512 values. Rather, the sinoid is cut off at some point, adding lots of energy at almost all frequencies, and also at power_spectrum[0]. You should create a test signal with e.g. 64 periods fitting exactly in 512 samples. Then, it should look as expected: one spectral line with lot of energy and the others close to 0. – Hartmut Pfitzinger Jul 11 '14 at 13:14
  • Did you already try a different test signal with e.g. 64 periods fitting exactly in your 512 samples analysis window? Actually, for test reasons I would also comment out the window function as it will broaden the width of the resulting spectral line. – Hartmut Pfitzinger Jul 14 '14 at 10:11
  • I commented the windowing out and increased the sample frequency andd also changed the size of the windows I get a lot of "peaks", see the update 2 I'm not sure but I thinks the the number of samples that I have, and the scaling of the frequency axis will solve this but I don't know whow to did it – Engine Jul 14 '14 at 10:34
  • Ok, you find an Add-On in my answer, how to do it. – Hartmut Pfitzinger Jul 14 '14 at 11:37
  • I don't understand why you use onnly 1 window for the test signal and I don't get what does the numberOfPeriod do ? but the result is similar to to what expect, not 100% correct but similar – Engine Jul 14 '14 at 11:56
  • 1
    See my more verbose explanations in the add-on part. Actually, your updated power spectrum looks very reasonable! – Hartmut Pfitzinger Jul 14 '14 at 13:04
  • thanks so much for your help I realy appreciate it ! thanks again ! – Engine Jul 14 '14 at 13:10
3

Some remarks to your expected output function.

  • Your input is a function with pure real values. The result of a DFT has complex values. So you have to declare the variable out not as double but as fftw_complex *out.

  • In general the number of dft input values is the same as the number of output values. However, the output spectrum of a dft contains the complex amplitudes for positive frequencies as well as for negative frequencies.

  • In the special case for pure real input, the amplitudes of the positive frequencies are conjugated complex values of the amplitudes of the negative frequencies. For that, only the frequencies of the positive spectrum are calculated, which means that the number of the complex output values is the half of the number of real input values.

  • If your input is a simple sinewave, the spectrum contains only a single frequency component. This is true for 10, 100, 1000 or even more input samples. All other values are zero. So it doesn't make any sense to work with a huge number of input values.

  • If the input data set contains a single period, the complex output value is contained in out[1].

  • If the If the input data set contains M complete periods, in your case 5, so the result is stored in out[5]

  • I did some modifications on your code. To make some facts more clear.


#include <iostream>
#include <stdio.h>
#include <math.h>
#include <complex.h>
#include "fftw3.h"

int performDFT(int nbrOfInputSamples, char *fileName)
{
    int nbrOfOutputSamples;
    double *in;
    fftw_complex *out;
    fftw_plan p;

    // In the case of pure real input data,
    // the output values of the positive frequencies and the negative frequencies
    // are conjugated complex values.
    // This means, that there no need for calculating both.
    // If you have the complex values for the positive frequencies,
    // you can calculate the values of the negative frequencies just by
    // changing the sign of the value's imaginary part
    // So the number of complex output values ( amplitudes of frequency components)
    // are the half of the number of the real input values ( amplitutes in time domain):
    nbrOfOutputSamples = ceil(nbrOfInputSamples/2.0);

    // Create a plan for a 1D DFT with real input and complex output
    in = (double*) fftw_malloc(sizeof(double) * nbrOfInputSamples);
    out = (fftw_complex*) fftw_malloc(sizeof(fftw_complex) * nbrOfOutputSamples);
    p = fftw_plan_dft_r2c_1d(nbrOfInputSamples, in, out, FFTW_ESTIMATE);

    // Read data from input file to input array
    FILE* inputFile = NULL;
    inputFile = fopen(fileName,"r");
    if(inputFile==NULL){
        fprintf(stdout,"couldn't open the file %s\n", fileName);
        return -1;
    }
    double value;
    int     idx = 0;
    while(!feof(inputFile)){
        fscanf(inputFile, "%lf", &value);
        in[idx++] = value;       
    }
    fclose(inputFile);

    // Perform the dft
    fftw_execute(p);

    // Print output results
    char outputFileName[] = "dftvalues.txt";
    FILE* outputFile = NULL;
   outputFile = fopen(outputFileName,"w+");
    if(outputFile==NULL){
        fprintf(stdout,"couldn't open the file %s\n", outputFileName);
        return -1;
    }
    double  realVal;
    double  imagVal;
    double  powVal;
    double  absVal;

    fprintf(stdout, "     Frequency  Real       Imag        Abs       Power\n");
    for (idx=0; idx<nbrOfOutputSamples; idx++) {
        realVal = out[idx][0]/nbrOfInputSamples; // Ideed nbrOfInputSamples is correct!
        imagVal = out[idx][1]/nbrOfInputSamples; // Ideed nbrOfInputSamples is correct!
        powVal  = 2*(realVal*realVal + imagVal*imagVal);
        absVal  = sqrt(powVal/2);
        if (idx == 0) {
            powVal /=2;
        }
        fprintf(outputFile, "%10i %10.4lf %10.4lf %10.4lf %10.4lf\n", idx, realVal, imagVal, absVal, powVal);
        fprintf(stdout,     "%10i %10.4lf %10.4lf %10.4lf %10.4lf\n", idx, realVal, imagVal, absVal, powVal);
        // The total signal power of a frequency is the sum of the power of the posive and the negative frequency line.
        // Because only the positive spectrum is calculated, the power is multiplied by two.
        // However, there is only one single line in the prectrum for DC.
        // This means, the DC value must not be doubled.

    }
    fclose(outputFile);


    // Clean up
    fftw_destroy_plan(p);
    fftw_free(in); fftw_free(out);

    return 0;

}

int main(int argc, const char * argv[]) {
    // Set basic parameters
    float   timeIntervall = 1.0;     // in seconds
    int     nbrOfSamples = 50;      //  number of Samples per time intervall, so the unit is S/s
    double  timeStep = timeIntervall/nbrOfSamples; // in seconds
    float   frequency = 5;          // frequency in Hz

    // The period time of the signal is 1/5Hz = 0.2s
    // The number of samples per period is: nbrOfSamples/frequency = (50S/s)/5Hz = 10S
    // The number of periods per time intervall is: frequency*timeIntervall = 5Hz*1.0s = (5/s)*1.0s = 5


    // Open file for writing signal values
    char fileName[] = "sinvalues.txt";
    FILE* outputFile = NULL;
    outputFile = fopen(fileName,"w+");
    if(outputFile==NULL){
        fprintf(stdout,"couldn't open the file %s\n", fileName);
        return -1;
    }

    // Calculate signal values and write them to file
    double  time;
    double  value;
    double  dcValue = 0.2;
    int idx = 0;
    fprintf(stdout, "     SampleNbr   Signal value\n");
    for (time = 0; time<=timeIntervall; time += timeStep){
        value =  sin(2*M_PI*frequency*time) + dcValue;
        fprintf(outputFile, "%lf\n",value);
        fprintf(stdout, "%10i %15.5f\n",idx++, value);
    }
    fclose(outputFile);

    performDFT(nbrOfSamples, fileName);
    return 0;

}
  • If the input of a dft is pure real, the output is complex in any case. So you have to use the plan r2c (RealToComplex).
  • If the signal is sin(2*pi*f*t), starting at t=0, the spectrum contains a single frequency line at f, which is pure imaginary.
  • If the sign has an offset in phase, like sin(2*pi*f*t+phi) the single line's value is complex.
  • If your sampling frequency is fs, the range of the output spectrum is -fs/2 ... +fs/2.
  • The real parts of the positive and negative frequencies are the same.
  • The imaginary parts of the positive and negative frequencies have opposite signs. This is called conjugated complex.
  • If you have the complex values of the positive spectrum you can calculate the values of the negative spectrum by changing the sign of the imaginary parts. For this reason there is no need to compute both, the positive and the negative sprectrum.
  • One sideband holds all information. Therefore the number of output samples in the plan r2c is the half+1 of the number of input samples.
  • To get the power of a frequency, you have to consider the positive frequency as well as the negative frequency. However, the plan r2c delivers only the right positive half of the spectrum. So you have to double the power of the positive side to get the total power.

    By the way, the documentation of the fftw3 package describes the usage of plans quite well. You should invest the time to go over the manual.

Heinz M.
  • 668
  • 3
  • 8
  • thanks a lot for your answer, but I've some questions , your plan is r2c , I've used the r2r since my input is pure real so I do need only the half of the + frequency ! 2. your program crashes since the ouputSamples size is only 1/2 inputSamples . Last question is why is the powVal multiplied by 2 ? thanks a lot again for your help ! – Engine Jul 15 '14 at 21:47
  • @Engine I don't know why the program crashes on your system. I use a Mac with OS X Mavericks. The code is written with Xcode 6.3 beta. I added some remarks to my previous remarks. – Heinz M. Jul 16 '14 at 18:08
1

I'm not sure what your question is. Your results seem reasonable, with the information provided.

As you must know, the PSD is the Fourier transform of the autocorrelation function. With sine wave inputs, your AC function will be periodic, therefore the PSD will have tones, like you've plotted.

My 'answer' is really some thought starters on debugging. It would be easier for all involved if we could post equations. You probably know that there's a signal processing section on SE these days.

First, you should give us a plot of your AC function. The inverse FT of the PSD you've shown will be a linear combination of periodic tones.

Second, try removing the window, just make it a box or skip the step if you can.

Third, try replacing the DFT with the FFT (I only skimmed the fftw3 library docs, maybe this is an option).

Lastly, trying inputting white noise. You can use a Bernoulli dist, or just a Gaussian dist. The AC will be a delta function, although the sample AC will not. This should give you a (sample) white PSD distribution.

I hope these suggestions help.

JayInNyc
  • 2,193
  • 3
  • 20
  • 21
  • the result that I get isn't correct , the DC != 0 which should be the case and about DFT||FFT the fftw lib suggest to use this functio to calculate the PSD . and ikf the result is periodic why aren'tthe peaks that I get equal ? – Engine Jul 11 '14 at 12:16
  • If you had provided the AC plot it would have been more helpful. The DC level may be non-zero, this statement is not correct. The PSD of a white noise series is one everywhere, including freq = 0. – JayInNyc Jul 11 '14 at 12:41