0

I have this data:

Array
(
    [firefox 3.0] => 2
    [chrome 24.0] => 1
    [ie 9.0] => 2
    [ie 10.0] => 1
)

Question: How to add series to achieve wanted chart?

My try:

JsFiddle: http://jsfiddle.net/fVrbQ

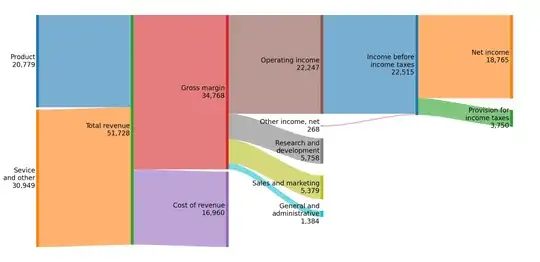
I want to have stacked chart like this:

chart

Ing. Michal Hudak
  • 5,338
  • 11
  • 60
  • 91

1 Answers1

0

You can set x for columns: http://jsfiddle.net/fVrbQ/1/

 series: [{
            name: 'firefox 3.0',
            data: [[0,2]],
            stack:0
        }, {
            name: 'chrome 24.0',
            data: [[1,1]],
            stack:1
        }, {
            name: 'ie 9.0',
            data: [[2,2]],
            stack:2
        }, {
            name: 'ie 10.0',
            data: [[2,1]],
            stack:2
        }]
Sebastian Bochan
  • 37,348
  • 3
  • 49
  • 75