4

This question is based on a previous similar question.

I have the following equation and an adjusted (some random data): 0.44*sin(N* 2*PI/30)

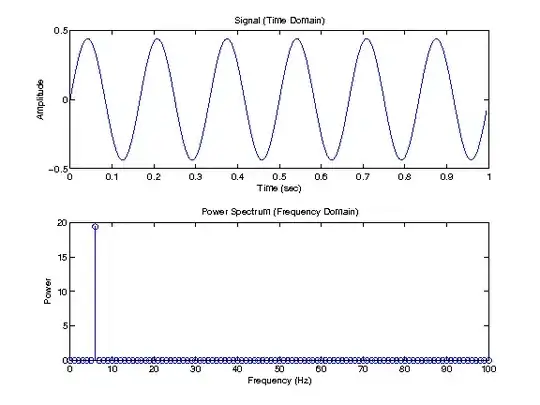
I am trying to use the FFT to get the frequency from the data generated. However the frequency ends up being close but not equal to the frequency (which makes the wave a bit larger than intended)

The frequencies that are at the maximum for the FFT is 7hz, however the expected frequency is (30/2PI) 4.77hz.

I've included a graph of the FFT and plotted values.

alt text

The code I am using is:

[sampleFFTValues sFreq] = positiveFFT(sampledata, 1);
sampleFFTValues = abs(sampleFFTValues);
[v sFFTV]= max(sampleFFTValues)

Positive FFT can be found here. Basically it centers the FFT graph and cuts off the negative signals.

My question is how can I get the FFT to be more accurate without having to resort to least squares for just the frequency?

Community
  • 1
  • 1
monksy
  • 14,156
  • 17
  • 75
  • 124
  • I believe that the problem is that your expected frequency (7hz) is too close to your lower frequency limit (1hz, I am assuming) and has thus lost most of its representational accuracy in the frequency dimension (you're going to have less than three *bits* left down there). I think that you need to recalibrate the whole thing to a domain that will allow *much* lower frequency domains, like about 0.1 to 0.01hz. – RBarryYoung Jan 21 '10 at 22:19
  • A guess: have you plotted the Frequency simply over bin index? because your frequencies and times absolutely don't match – peterchen Jan 21 '10 at 22:49
  • Zero pad your data to say 256, to increase the frequency resolution. – Paul Feb 07 '10 at 07:55

7 Answers7

5

I don't think FFT is good for a fine-resolution frequency measurement for (quasi)periodic signals - see below.

Every discrete FFT has spreading on non-integer bin frequencies (that is on any frequency which does not exactly correspond to one of the frequency steps of the particular FFT); these "intermediate" frequencies will be smeared/spread out around the nearest integer bin. The shape of this spreading ("spreading function") depends on the windowing function used for the FFT. This spreading function - to simplify and generalize things - is either very narrow but very-very ragged (very high peaks/very low valleys), or wider but less ragged. In theory, you could do a very fine frequency sweep of sine waves and calculate FFT for each of them, and then you could "calibrate" the function's shape and behaviour by saving outputs of all FFTs together with the frequency that resulted in that output, and then by comparing the FFT output of the signal to be measured to the previously saved results and finding the "closest" one find a more exact frequency.

Lots of effort.

But don't do this if you only need to measure frequency of a single signal.

Instead try to measure wavelength. This can be as simple as measuring the distance between zero crosses (perhaps for multiple cycles to get more precision - heck, measure 1000 cycles if you have that many) in samples, and divide the sample rate by that to arrive at the frequency. Much simpler, faster and much more precise.

Example: 48000 Hz sample rate, 4.77 Hz signal results in ~0.0005 Hz resolution just by measuring the length of one cycle with the crudest approach. (If you take n cycles, the frequency resolution multiplies by n as well.)

Bandi-T
  • 3,231
  • 1
  • 20
  • 15
  • I thought about doing that. The only issue is that the frequency may change later down the road. But, it looks like that may be my best option, since after all I have normalized the data to be 0 centered. – monksy Jan 21 '10 at 21:20
  • 2
    I don't see a problem there: if the frequency changes the wavelength changes, you measure the new wavelength, do the division - bang, result: new frequency. Or maybe I don't understand what you are trying to do. – Bandi-T Jan 21 '10 at 21:27
  • 2
    Zero crossings are *very* sensitive to real-life data: Even simple sensor noise can give you additional zero crossings - smoothing is the simplest solution *if* you know what frequency to look for. Many system generate additional frequency components (distortion), are susceptible to power supply humming, or capture environmental noise at notable levels. – peterchen Jan 21 '10 at 21:45
  • All that is true, and I too wanted to go into filtering after OP told more about problem, as the problem as stated in the question above has no noise. – Bandi-T Jan 21 '10 at 22:14
  • I just guess that's a test for somethign where he ends up with "real" data one way or another – peterchen Jan 21 '10 at 23:08
  • well the red signal in the graph has little no no noise [most of it is normalized out] Its not enough noise to skew the result though – monksy Jan 22 '10 at 03:12
5

As mentioned by others, you are misinterpreting the frequency of the signal. Let me give an example to clear a few things:

Fs = 200;                        %# sampling rate
t = 0:1/Fs:1-1/Fs;               %# time vector of 1 second 
f = 6;                           %# frequency of signal
x = 0.44*sin(2*pi*f*t);          %# sine wave

N = length(x);                   %# length of signal
nfft = N;                        %# n-point DFT, by default nfft=length(x)
                                 %# (Note: it is faster if nfft is a power of 2)
X = abs(fft(x,nfft)).^2 / nfft;  %# square of the magnitude of FFT

cutOff = ceil((nfft+1)/2);       %# nyquist frequency
X = X(1:cutOff);                 %# FFT is symmetric, take first half
X(2:end -1) = 2 * X(2:end -1);   %# compensate for the energy of the other half
fr = (0:cutOff-1)*Fs/nfft;       %# frequency vector

subplot(211), plot(t, x)
title('Signal (Time Domain)')
xlabel('Time (sec)'), ylabel('Amplitude')

subplot(212), stem(fr, X)
title('Power Spectrum (Frequency Domain)')
xlabel('Frequency (Hz)'), ylabel('Power')

time_frequency_domain

Now you can see that the peak in the FFT corresponds to the original frequency of the signal at 6Hz

[v idx] = max(X);
fr(idx)
ans = 
      6

We can even check that Parseval's theorem holds:

( sum(x.^2) - sum(X) )/nfft < 1e-6

Option 2

Alternatively, we can use the signal processing toolbox functions:

%# estimate the power spectral density (PSD) using the periodogram
h = spectrum.periodogram;
hopts = psdopts(h);
set(hopts, 'Fs',Fs, 'NFFT',nfft, 'SpectrumType','onesided')

hpsd = psd(h, x, hopts);
figure, plot(hpsd)

Pxx = hpsd.Data;
fr = hpsd.Frequencies;
[v idx]= max(Pxx)
fr(idx)

avgpower(hpsd)

periodogram

Note that this function uses a logarithmic scale: plot(fr,10*log10(Pxx)) instead of plot(fr,Pxx)

Amro
  • 123,847
  • 25
  • 243
  • 454
  • That is pretty much what I did, how is that different? – monksy Jan 22 '10 at 05:44
  • 1
    Like I mentioned, you are probably incorrectly interpreting the signal frequency. I mean from what i understood from the question, even if you random noise (in a reasonable manner) you should still be able to recover the frequency of the sinusoidal exactly (try it by adding: `x = x + 0.5*randn(size(t));` in the beginning) – Amro Jan 22 '10 at 06:59
1

What you are looking for is a frequency estimation method, and there are many. An FFT is one component of several estimation methods. Just using the peak magnitude bin, as in your example, gives you the worst resolution (but the greatest noise immunity to any other exactly periodic sinusoids). In low noise situations, you can interpolate. Parabolic interpolation of the log magnitude is one common estimator, but Sync interpolation of the FFT results may be better for a rectangular window. Zero-padding and doing a longer FFT is basically equivalent to interpolation.

For an exact sinusoid in zero noise, forget the FFT, and just solve the equation in 3 unknowns, which may involve as little as 3 or 4 non-aliased sample points, algorithms for doing this here and here.

I list a few other frequency estimation methods on my DSP web page.

hotpaw2
  • 70,107
  • 14
  • 90
  • 153
1

Assuming N is time in seconds, your frequency is 1/30Hz (y=A * sin( 2* PI * f * t))

Frequency Resolution = Sample Rate / FFT Points

The sample rate is determined by the nyquist criterium, the sample rate (samples/second) must be at least two times the maximum frequency to be analyzed, e.g. 48kHz for analysing up to 24kHz. (For "real life" data, it's good to have a bit of a buffer).

So, you might need to increase the size of your FFT.

peterchen
  • 40,917
  • 20
  • 104
  • 186
  • The nyquist doesn't really come into it here, as we can see several complete cycles within the sample, and the expected answer is actually lower than the answer generated. – Phil H Jan 21 '10 at 21:40
  • The red and green waves on the graph are the actual data, the blue and yellow are best fit from the FFT result. – monksy Jan 21 '10 at 21:48
  • @Phil: it defines the lower limit of sample frequency, It's "OK" for the results given, but still must be considered. -- @steven: I'm not sure what's going on, as othjers noted, too, you should get vastly different values anyway. – peterchen Jan 21 '10 at 22:09
0

If you are generating from a function, versus working with samples, you can generate a LOT of points and run a BIG fft so the frequency bins are very small for high precision. But it won't solve the basic problem.

Joe Koberg
  • 25,416
  • 6
  • 48
  • 54
  • The sample data [as graphed] is a limited points, but the "best fit data" is generated from a function. – monksy Jan 21 '10 at 21:47
0

First, a correction to your question: (30/2PI) is not the frequency. The frequency of your signal is 1/30 * whatever sampling rate you have used. Second, can you tell me what was the length of sampledata vector? When FFT returns a vector of values, the ith value will correspond to f_i = i/N where N is length of vector and i \in [0,N-1] You want i/N to exactly equal 1/30 for some integer i. In other words, N should equal 30*i, i.e., N should be a multiple of 30. Now, was the length of vector you used, a multiple of 30? If not try making it, and that should solve the problem.

morpheus
  • 18,676
  • 24
  • 96
  • 159
-1

Try a windowing function?

Jay Kominek
  • 8,674
  • 1
  • 34
  • 51
  • 2
    How would a windowing function solve the problem? Also how does it have anything to do with FFT and accuracy? – monksy Jan 21 '10 at 21:21
  • @steven: At present the edges of the signal are simply truncated, which will introduce a lot of new frequencies. Applying a windowing function will smooth the start and end, and remove/reduce these added frequencies, depending on the function. – Phil H Jan 21 '10 at 21:38
  • @Jay: Do you want to elaborate for the benefit of those who don't know what effect a window has? – Phil H Jan 21 '10 at 21:38
  • @Phil H: It is discussed relatively well in the Wikipedia article linked in this answer. I recommend consulting that first. – Bandi-T Jan 21 '10 at 21:40
  • Where the data on the graph ends is where the data ends. That is the range of data to examine. – monksy Jan 21 '10 at 21:46
  • @Phil H: the ringing you get from truncation should be well below the signal line. – peterchen Jan 21 '10 at 22:10
  • Since the peak for the signal is probably not going to be perfectly in a single bin, I figured the ringing could be adding up in neighboring bins, pulling the peak to the left a bit. (Despite it being miniscule compared to the peak.) Also, if steven is using matlab, it should take about 30 seconds to try. http://www.mathworks.com/access/helpdesk/help/toolbox/signal/f9-131178c.html#f9-140546 – Jay Kominek Jan 21 '10 at 22:23
  • -1 : windowing helps removes adjacent interference and spectral "splatter", but worsens frequency estimation accuracy in zero and very low noise situations by making the peak fatter. – hotpaw2 Apr 17 '12 at 22:49