4

I've been trying to fit a function to some data for a while using scipy.optimize.curve_fit but I have real difficulty. I really can't see any reason why this wouldn't work.

# encoding: utf-8
from __future__ import (print_function,
                        division,
                        unicode_literals,
                        absolute_import,
                        with_statement)
import numpy as np
from scipy.optimize import curve_fit
import matplotlib.pyplot as mpl

x, y, e_y = np.loadtxt('data.txt', unpack=True)

def f(x, a, k):
    return (1/(np.sqrt(1 + a*((k-x)**2))))

popt, pcov = curve_fit(f, x, y, maxfev = 100000000)

mpl.plot(x, f(x, *popt), 'r-', label='Fit')
mpl.plot(x, y, 'rx', label='Original')
mpl.legend(loc='best')
mpl.savefig('curve.pdf')
print(popt)

# correct values which should be calculated
# a=0.003097
# k=35.4

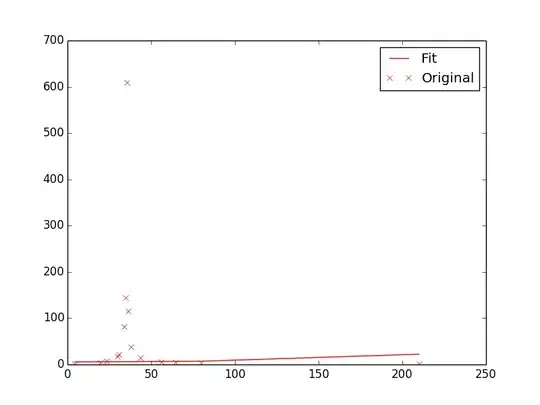
Here is the plot-image which is produced by upper code: enter image description here

data.txt:
#x      y       e_y
4.4     0.79    0.13
19.7    4.9     0.8
23.5    7.3     1.2
29.7    17      2.79
30.7    21.5    3.52
34      81      13.28
34.6    145     23.77
35.4    610     100
36.3    115     18.85
38.1    38      6.23
43.7    14      2.3
56.2    6.2     1.02
64.7    4.6     0.75
79.9    3.2     0.52
210     0.98    0.16
Cleb
  • 25,102
  • 20
  • 116
  • 151
  • what kind of function is `f`? – Juh_ Oct 11 '13 at 09:27
  • why did you choose `curve_fit` as optimizer? – Juh_ Oct 11 '13 at 09:41
  • 1
    @Juh_ I chose `curve_fit` because I do not know an alternative to it. Maybe you can tell me, which optimizer would be a better one. Thanks –  Oct 11 '13 at 12:45
  • The point of my questions were on the choice of optimization with respect to the problem to optimize (`f`&data). The answer of Greg is good. – Juh_ Oct 12 '13 at 07:04

2 Answers2

16

Firstly try not to increase maxfev so large, this is usually a sign something else is going wrong! Playing around I can get a fit by the following addition:

def f(x, b, a, k):
    return (b/(np.sqrt(1 + a*((k-x)**2))))

popt, pcov = curve_fit(f, x, y, p0=[20, 600.0, 35.0])

Firstly give the fitting function you have given has a maximum of 1, since the peak in your data is 600, it will never fit. So I added an overall factor b. Secondly , try to help poor old curve_fit out. If by eye you can see it peaks at x~35 then tell it through the p0. This requires some intuition as to how the function works but is very important if your going to use a curve fitting function.

enter image description here

Greg
  • 11,654
  • 3
  • 44
  • 50
  • @Greg Hello, thank you for your great answer. I understand your explanation. Unfortunately I'm forced to use the given function, which means your additional factor `b` has to be 1. I'm not allowed to change it in this exercise. Maybe you can tell me another way to get the correct values for `a` and `k ` I already mentioned in the code. Thank you. –  Oct 11 '13 at 12:44
  • @Greg Sorry, you're absolutely right. The given function is simply "wrong" and will never fit the data. Unsolvable, incorrect exercises are really annoying. Thank you for your help! –  Oct 11 '13 at 13:35
  • 1
    Marsch, it seems likely to me that there is something missing from the question. If you were to normalise the data you have then this function would work fine, does it ask you to normalise it? If it doesn't then it should, or give you the function with b. – Greg Oct 11 '13 at 13:40
1

I looked at the raw data on an X-Y scatterplot, an equation to fit this data appears to require a very sharp, narrow peak. The equation you have been given will not yield a peak response. In my opinion, a fit of this data to the given equation won't work for this reason.

Cleb
  • 25,102
  • 20
  • 116
  • 151
James Phillips
  • 4,526
  • 3
  • 13
  • 11