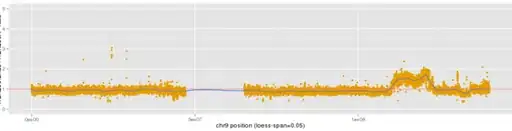
(this follows ggplot2 loess Q for which I got a nice answer) -- leading to this plot:
My R knowledge is quite limited (sorry!)
I plot a scatter using data from a table data1.
data1<-NaRV.omit(data[,c(2,3,7,10)]) #(2=start, 3=end, 7=value, 10=type)
ylabs='E / A - ratio'
p1<-ggplot(data1, aes(x=start, y=value)) +
ylim(0,5) +
geom_point(shape=points, col=pointcol1, na.rm=T) +
geom_hline(aes(yintercept=1, col=linecol)) +
geom_smooth(method="loess", span=spanv, fullrange=F, se=T, na.rm=T) +
#
xlab(xlabs) +
ylab(ylabs)
Some regions have no-data (incl one big region in the middle but also smaller discrete regions) where I would like to draw a colored segments at y=0 to illustrate this fact
I combined both data types into one table with a label column#10='type' (content for the scatter data ='cnv' and for the no-data='nregion'). nregions have 0 in the value column.
How can I take only 'cnv' data for the scatter and only 'nregion' data to draw the segments; both on the same plot?
I found geom_segment:
+ geom_segment(aes(x=data1$start, y=0, xend=data1$end, yend=0))
BUT I did not find a way to subset for each ggplot sub-plot.
Thanks
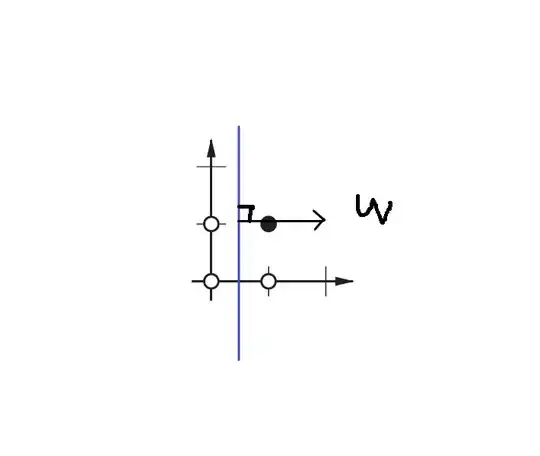
#### follow up on @gauden solutionHi @gauden I tried your approach and it partly worked. My problem is that I cannot divide my data as nicely as you do using ]-1; 0] because my nregions are scattered (represented by the blue dots and lines in the picture) and are different for each new graph, as in this image:
Consequently, the loess goes through the large nregion as before. How can I prevent loess in nregions?
#############################
## plot settings (edit below)
spanv<-0.1
pointcol1="#E69F00"
pointcol2="#56B4E9"
pointcol3="#009E73"
points=20
onecol="green"
colnreg="blue"
xlabs=paste(onechr, " position", " (loess-span=", spanv, ")", sep="")

##### end edit ##############

########################################################
## using the center coordinate of each segment and points

## prepare plot #1
# plot E / A - ratio
## draw loess average for cnv
## draw line for nregion
ylabs='E / A - ratio'
p1<-ggplot(chrdata, aes(x=start+1000, y=E.R, group=type, label=type)) +
ylim(0,5) +
geom_hline(aes(yintercept=1, col=onecol)) +
geom_point(data = chrdata[chrdata$type != 'nregion',], shape=points, col=pointcol2) +
geom_smooth(data = chrdata[chrdata$type != 'nregion',], method="loess", span=spanv) +
geom_point(data = chrdata[chrdata$type == 'nregion',], col=colnreg) +
geom_segment(data = chrdata[chrdata$type == 'nregion',], aes(x=start, y=E.R, xend=end, yend=E.R), colour=colnreg, linetype=1, size=1) +
xlab(xlabs) +
ylab(ylabs)
